

Quad Regime Investing
Considering the Alternatives: Navigator Approach to Portfolio Management How best to protect and grow wealth? ...


JANUARY 20TH: LATE IN THE CYCLE
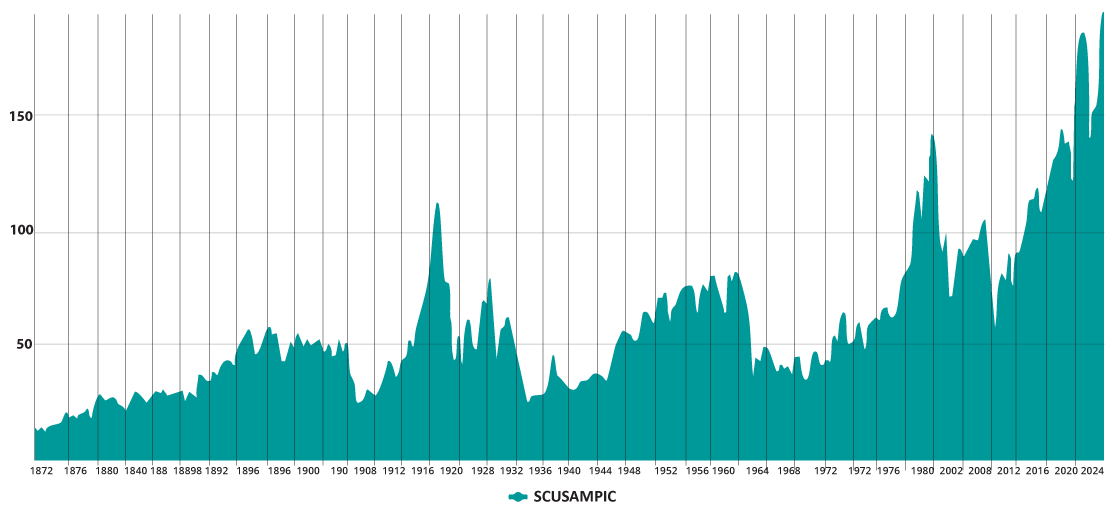
The Market Cap to GDP Ratio gives an indication of how big the financial world has gotten relative to the real one. Previous extremes have often portend of significant set backs in equities ahead.
Most noticeable is that for the first time in history the US stock market capitalisation to GDP ratio has broken through the 200% mark. A reflection of the time we live in with regards to US leadership in global markets, but also the stage we are at in the market cycle.
JANUARY 6TH: LATE IN THE CYCLE
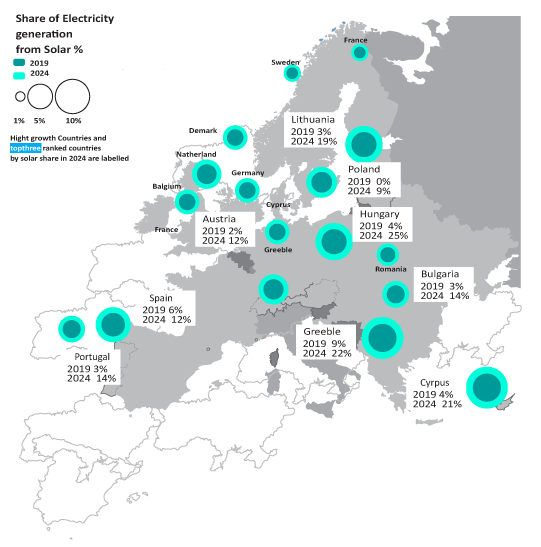
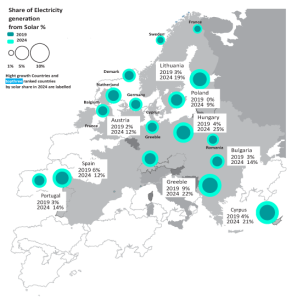
The EU’s solar success story continued in 2024, as the bloc saw a record annual increase in solar generation. In fact, 2024 marked a record annual increase in solar generation, up 54 TWh (+22%) compared to 2023, when solar generation had already increased by 40 TWh compared to 2022. 2024 was also a record year for annual capacity additions: the EU solar fleet grew by 66 GW, equal to over 450,000 panels added per day
An accelerated rollout of batteries and smart electrification will be key to cost-effectively sustaining solar’s impressive growth. Solutions such as batteries and smart electrification are already mature and ready to deploy, but require policy action to reach their full potential.
JANUARY 13TH: RUNNING ON FUMES
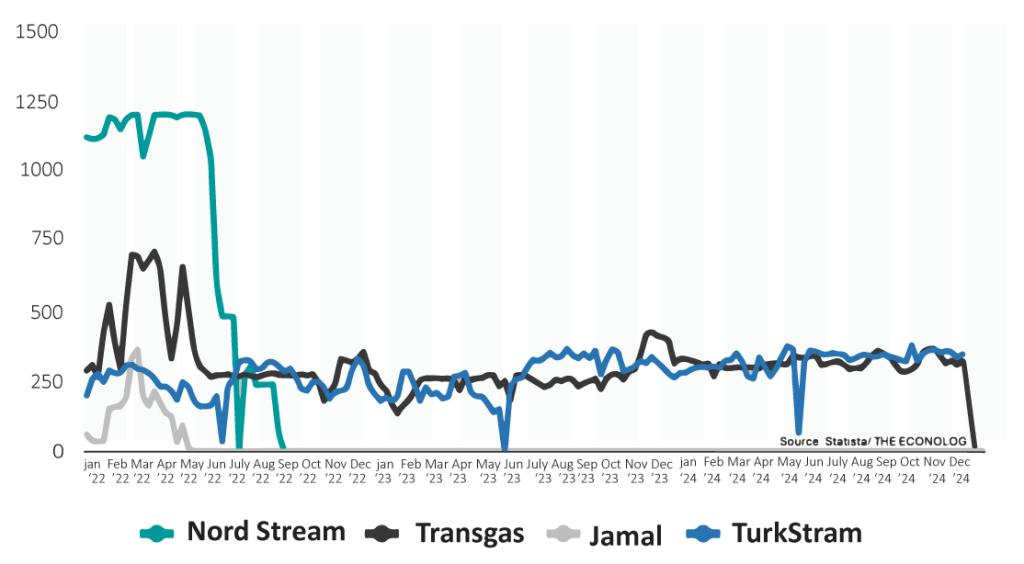
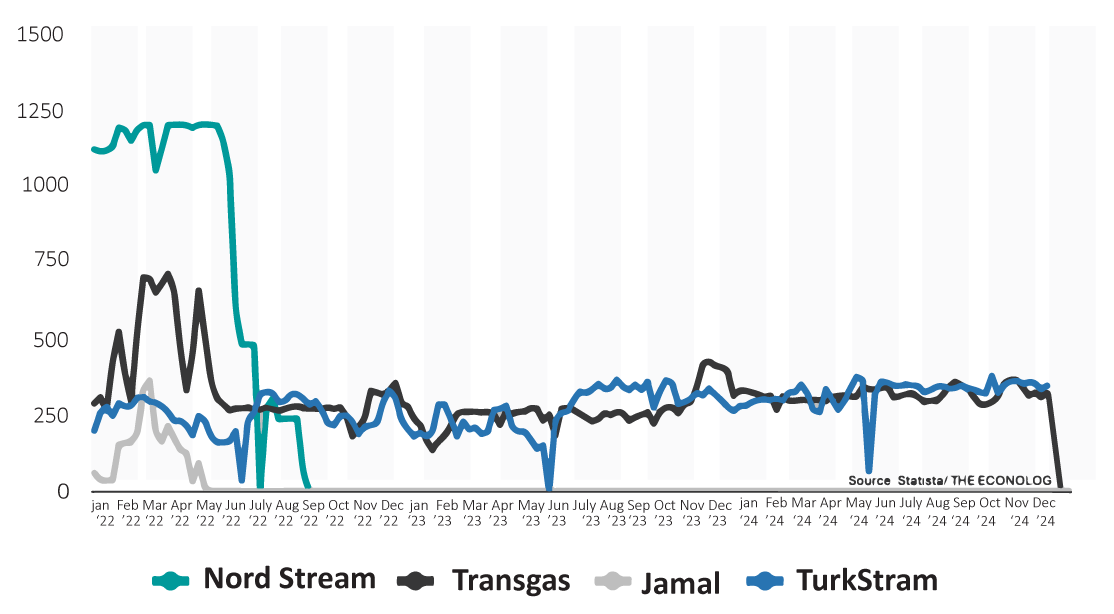
On December 26, 2024, Ukrainian President Volodymyr Zelensky announced he wasn’t going to renew a contract to route Russian gas to Europe. It was another unwelcome surprise for European consumers and companies. The Ukraine route was the last pipeline connecting Russian gas directly to central Europe, delivering about 320 million cubic meters per week to Slovakia, Hungary, and Austria. When the contract expired on January 1, 2025, deliveries dropped to zero.
After shutting down Transgas, TurkStream is the only remaining supplier of Russian gas to Europe.
Last Man Standing
DECEMBER 30TH: GOLD VS STOCKS:
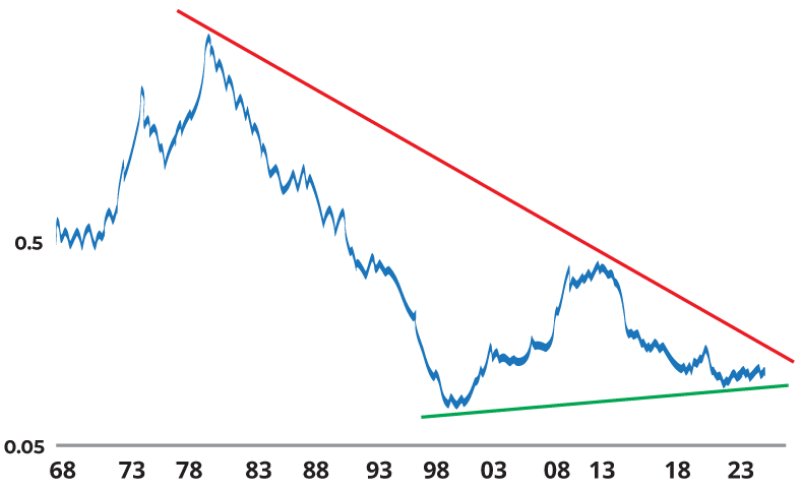
Despite the epic bull run in gold, it’s “only” just kept pace with US equities at the time of writing – circa 26% YTD. Moreover, the below suggests there is still a long way to run. The most likely reason for this chart to turn up (if it does), would be for equities to enter a correction/bear market, and gold to either hold its ground or continue to move higher. These triangle patterns can be very reliable and the longer the time frame, (30 years), the more powerful the signal would be
Gold VS Stocks
(Stocks=S&P 500 Index ,including dividends)

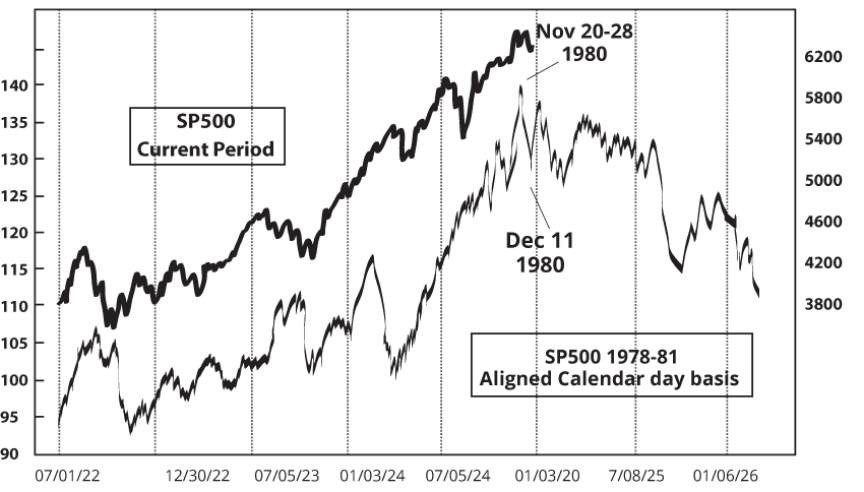
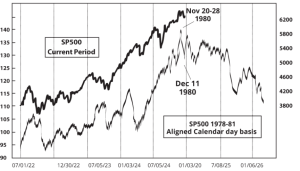
DECEMBER 23RD: REAGANOMICS REDUX
The below sets out an uncanny development – it appears that things are largely following a former Republican presidential beginning. As Jason Goepfort points out: “Reagan’s victory [in 1980] was both anticipated and celebrated by Wall Street, as he was seen as a “transformative” candidate with the promise of solving all of the problems which faced the country then. And Reagan arguably was a transformative president, but the first two years were not a pleasant time to be a stock investor”
Countries with the Most Gold
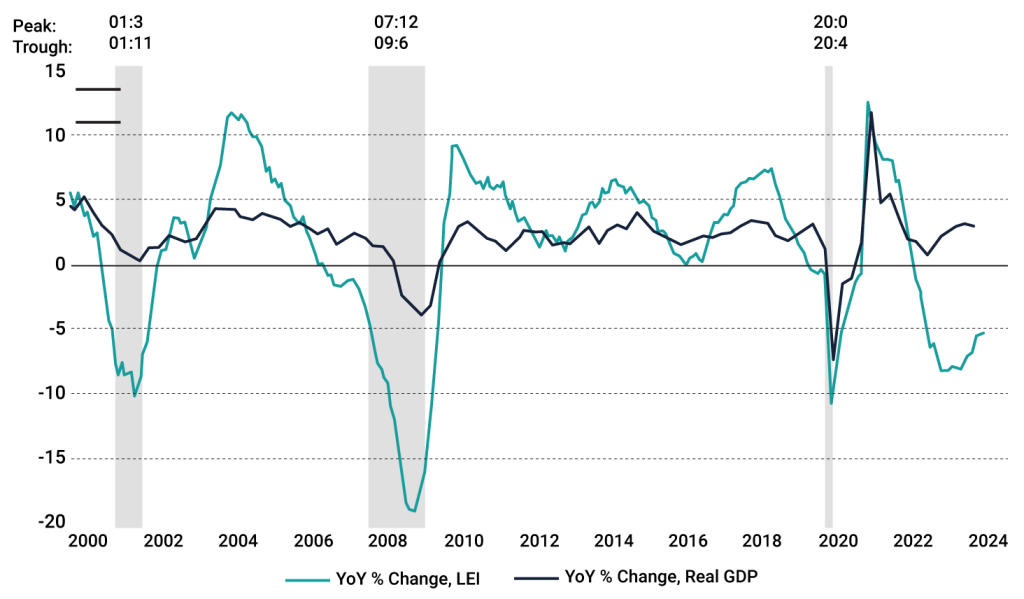
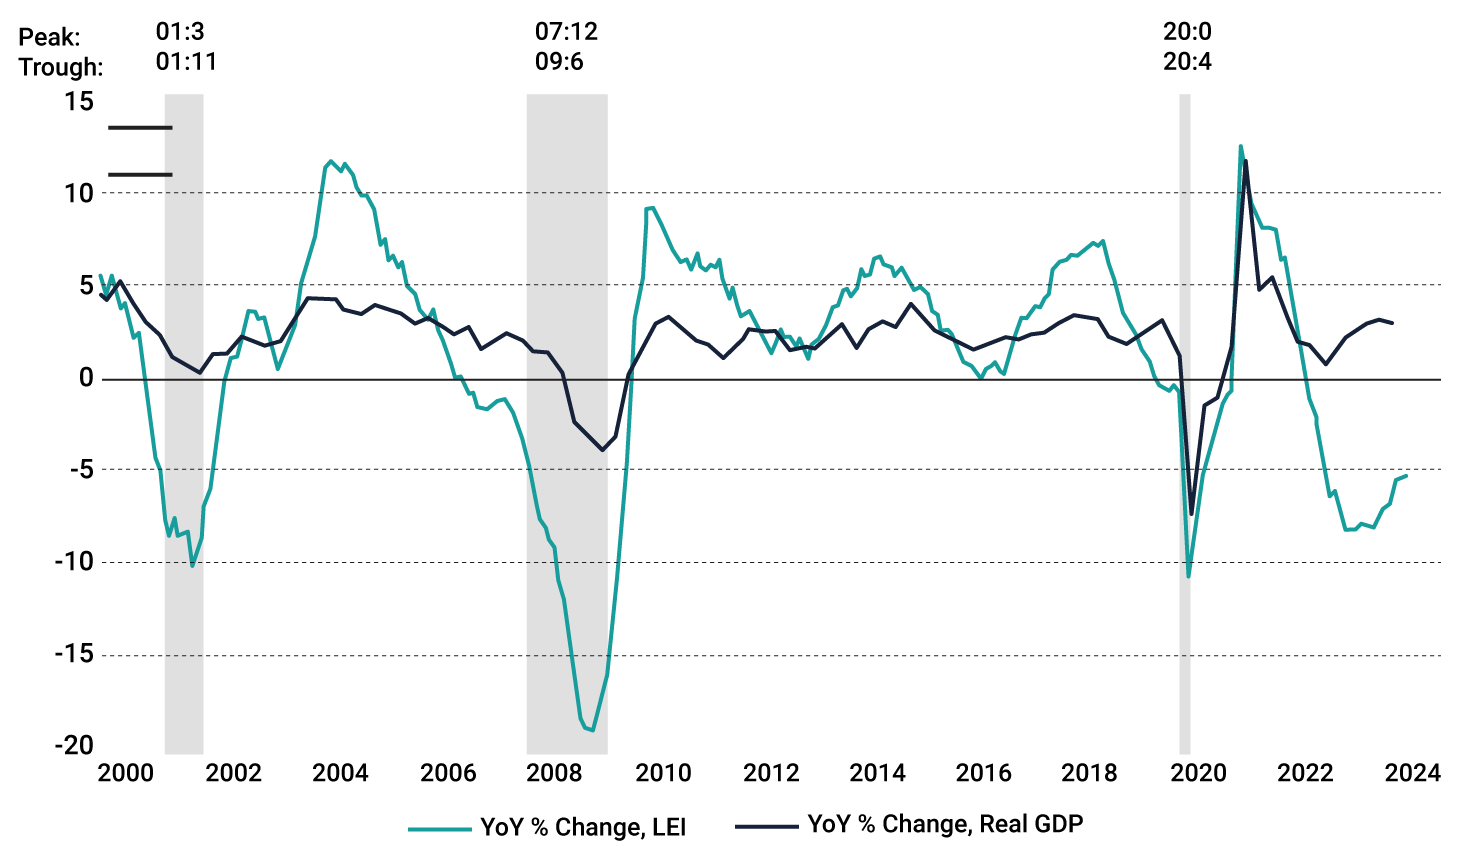
DECEMBER 16TH: RECESSION WATCH
While there are no glaring obvious signs of recession right now, there are some indicators alerting us to stay on guard, for example the chart below which shows the relative performance of Walmart vs global luxury stocks. The idea is that staples like Walmart hold up during recession, while luxury stocks suffer from cutbacks in consumer spending. It’s also worthy of note though, that some of the weakness in global luxury stocks may be more of a reflection of the economic slowdown in China (and Europe, not to mention Russia). However, consumer data in the US is undeniably weakening, and credit card delinquencies moving higher suggesting a consumer that is stretched….
WallMart Recession Signal Vs. US Corporate Credit Spreads
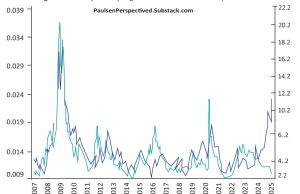
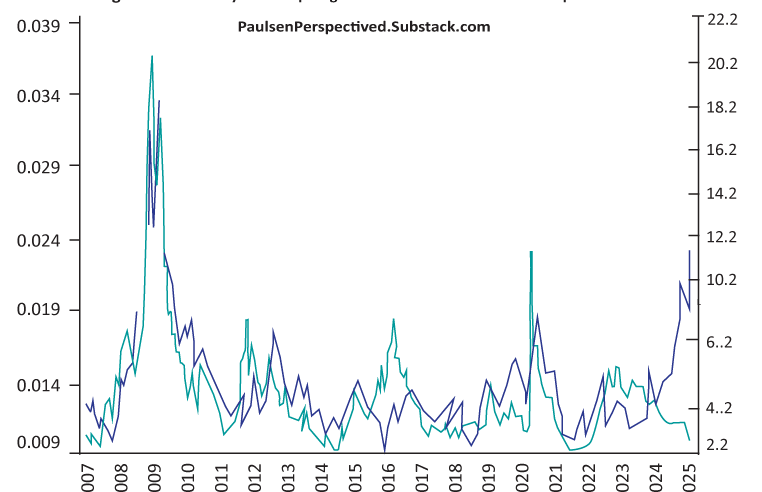
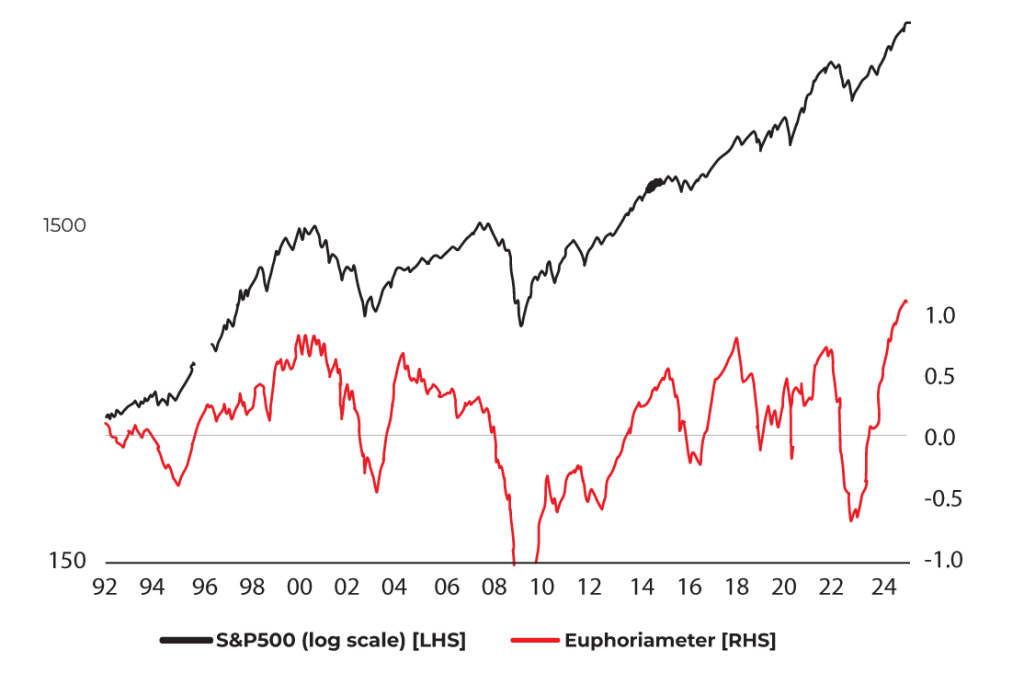
DECEMBER 9TH: BUBBLICIOUS
Peak Euphoria: After a string of back-to-back new all-time highs in this indicator, the flash December reading has come in ever so slightly lower than the November reading. One thing to note with indicators like this is that they send the most powerful signals when they reach an extreme and then turnaround — was November a climax in stock market euphoria? The market is more than overdue a reset.
The Euphoriameter
Combination of Forward PE , VIX , Bullish Sentiment

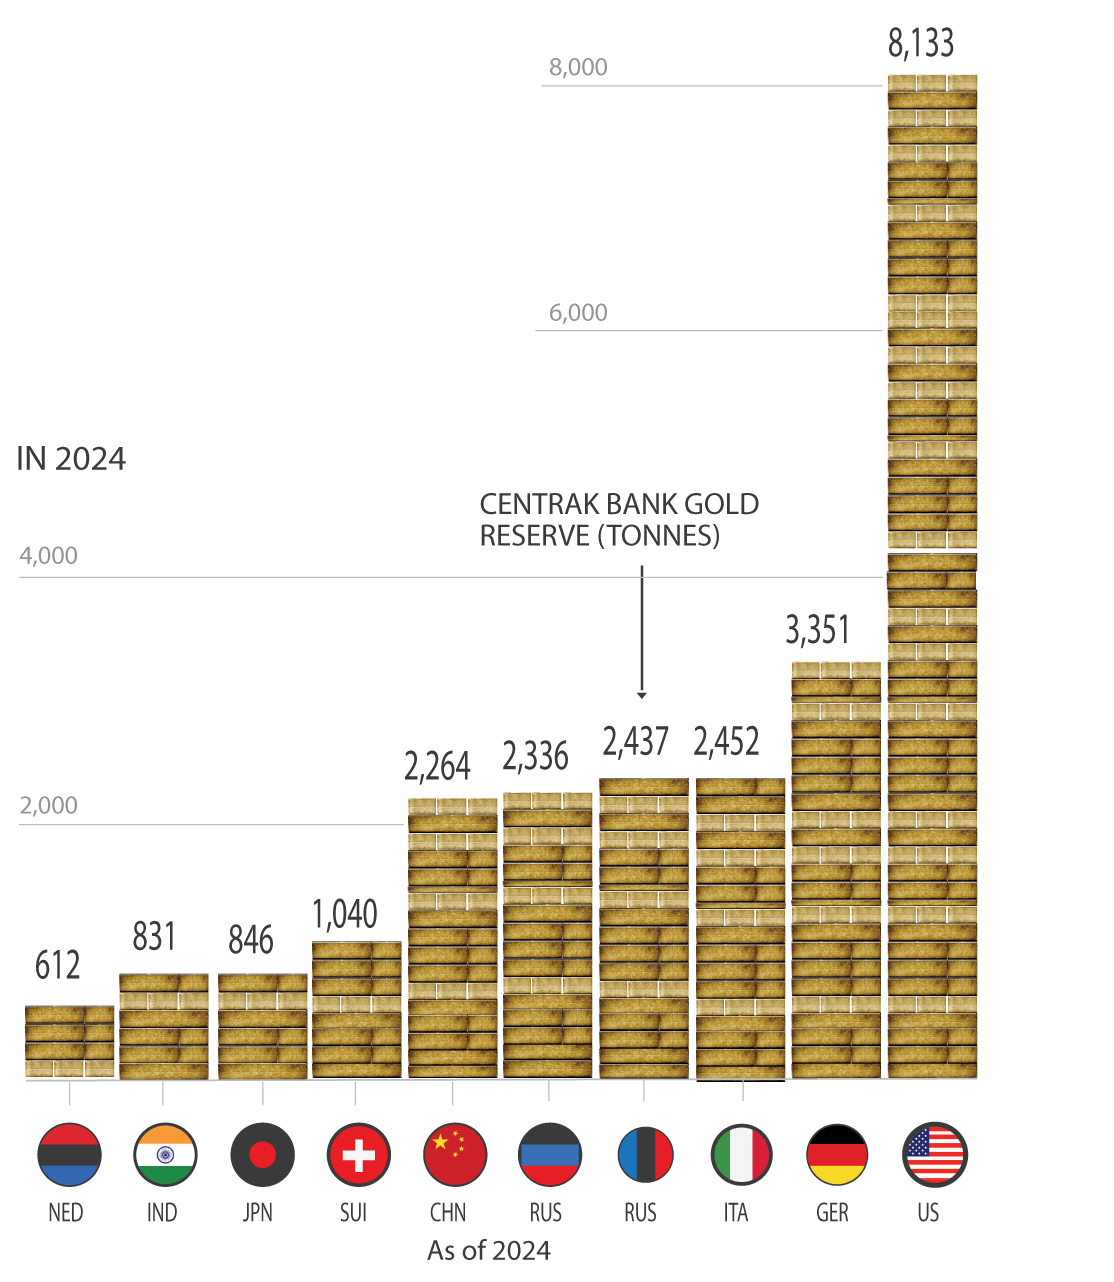
NOVEMBER 25TH: GOLDEN HANDCUFFS
This chart shows the top 10 countries by Central Bank Gold Reserves — while it might be old news for some (and it is May 2024 data), the standout is how even though China + Russia have been important buyers, they still trail well behind the USA and the combined holdings of Eurozone countries. Perhaps the Federal Reserve and Jerome Powell knows something the rest of us don’t.
Countries with the Most Gold
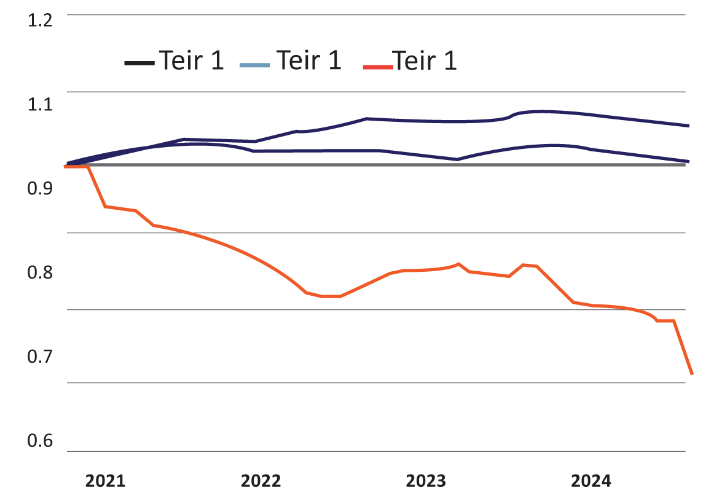
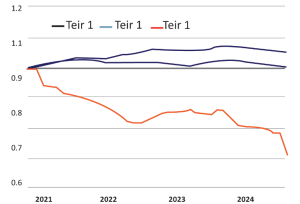
NOVEMBER 18TH: CHINESE CRACKERS
China’s real estate market continues to concern. Between 2008 and 2023, household debt rose from less than 20% to over 60% of GDP. This development was directly linked to the credit-financed real estate boom, which drove cities such as Beijing and Shanghai into extreme price bubbles. The ratio of house prices to income is now twice as high as in London – an unmistakable sign of overheating. However, the situation is even more serious in the smaller cities, which contribute around 60% of China’s GDP.
Price Variation
China’s smallar tier 3 Cities have seen the sharpest slide in property prices.
(house price chnages by city ties ; Jan .2021=1)
NOVEMBER 11TH: DISTRIBUTED LEDGER
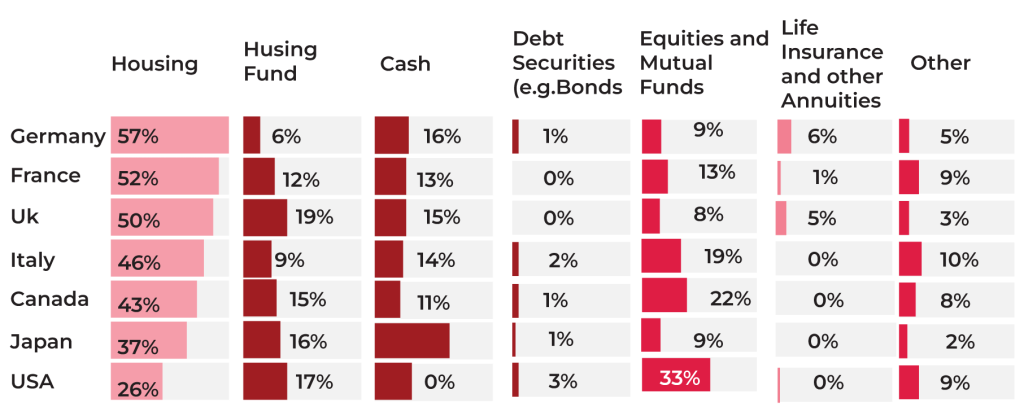
A recent report from Abrdn which found that UK adults hold the smallest percentage of their wealth in equities or mutual funds of any G7 country (8%) and that almost half of UK adults think property is a better long-term investment than pensions. That is in stark contrast to UJ households – but perhaps less surprising when the last 15 years of returns of the FTSE 100 vs S&P 500 are taken into consideration.
How people’s personal wealth is split across assert classes
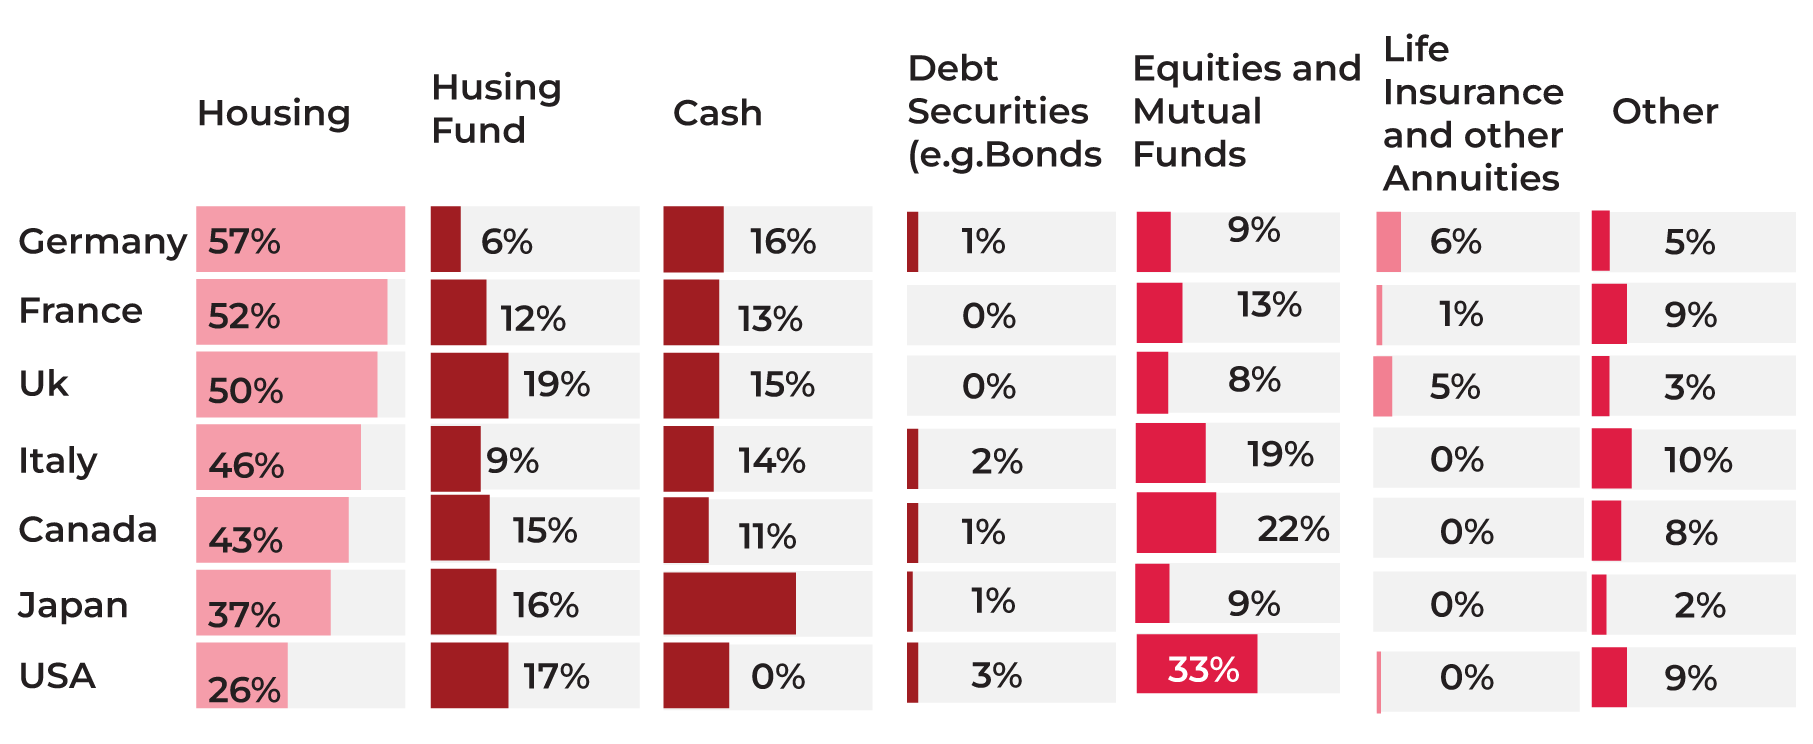 Based on abran analysis of data from individual countries’ financial accounts. Figures are the latest available data, released in 2023. Cash includes currency deposits and money market funds
NOVEMBER 4TH: THE NEW MIDDLE KINGDOM
The notoriously power-hungry president of the country, Recep Tayyip Erdoğan, is in a position to recreate the Ottoman Empire, if not politically then economically: sourcing oil and gas across the Middle East and distributing it to southeastern Europe and up until Hungary and Austria, plus Greece and Italy. Such a strategy will provide Turkey with massive political and economic influence over large parts of Europe. The population belt that stretches from Istanbul to Jakarta could in itself have parallels to that of China’s post 2004 growth explosion.
A new Ottoman Energy Empire?

OCTOBER 28TH: UNPRECEDENTED
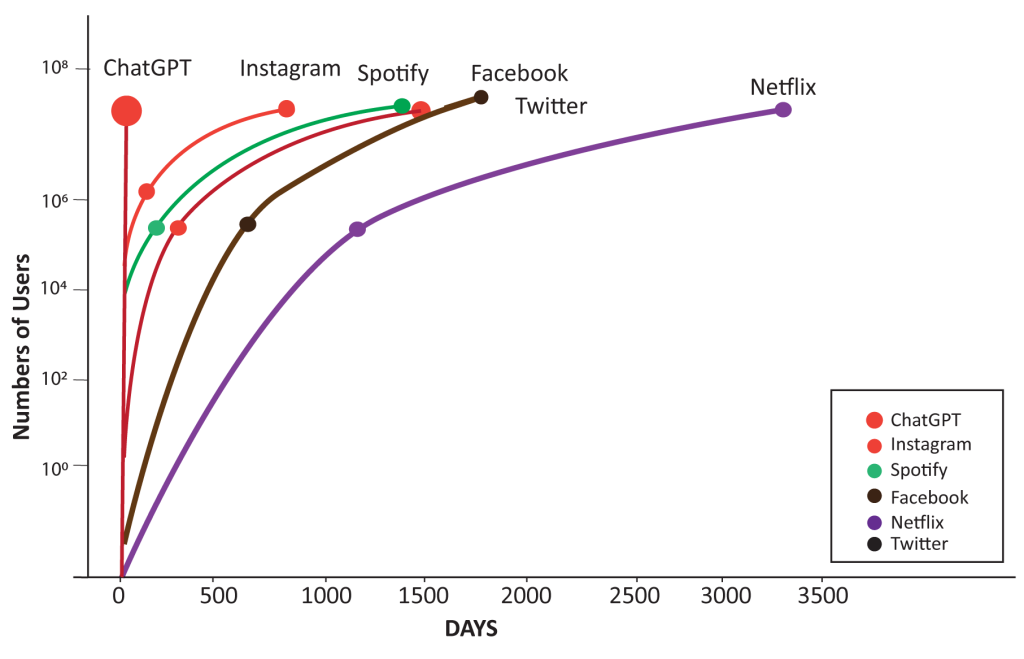
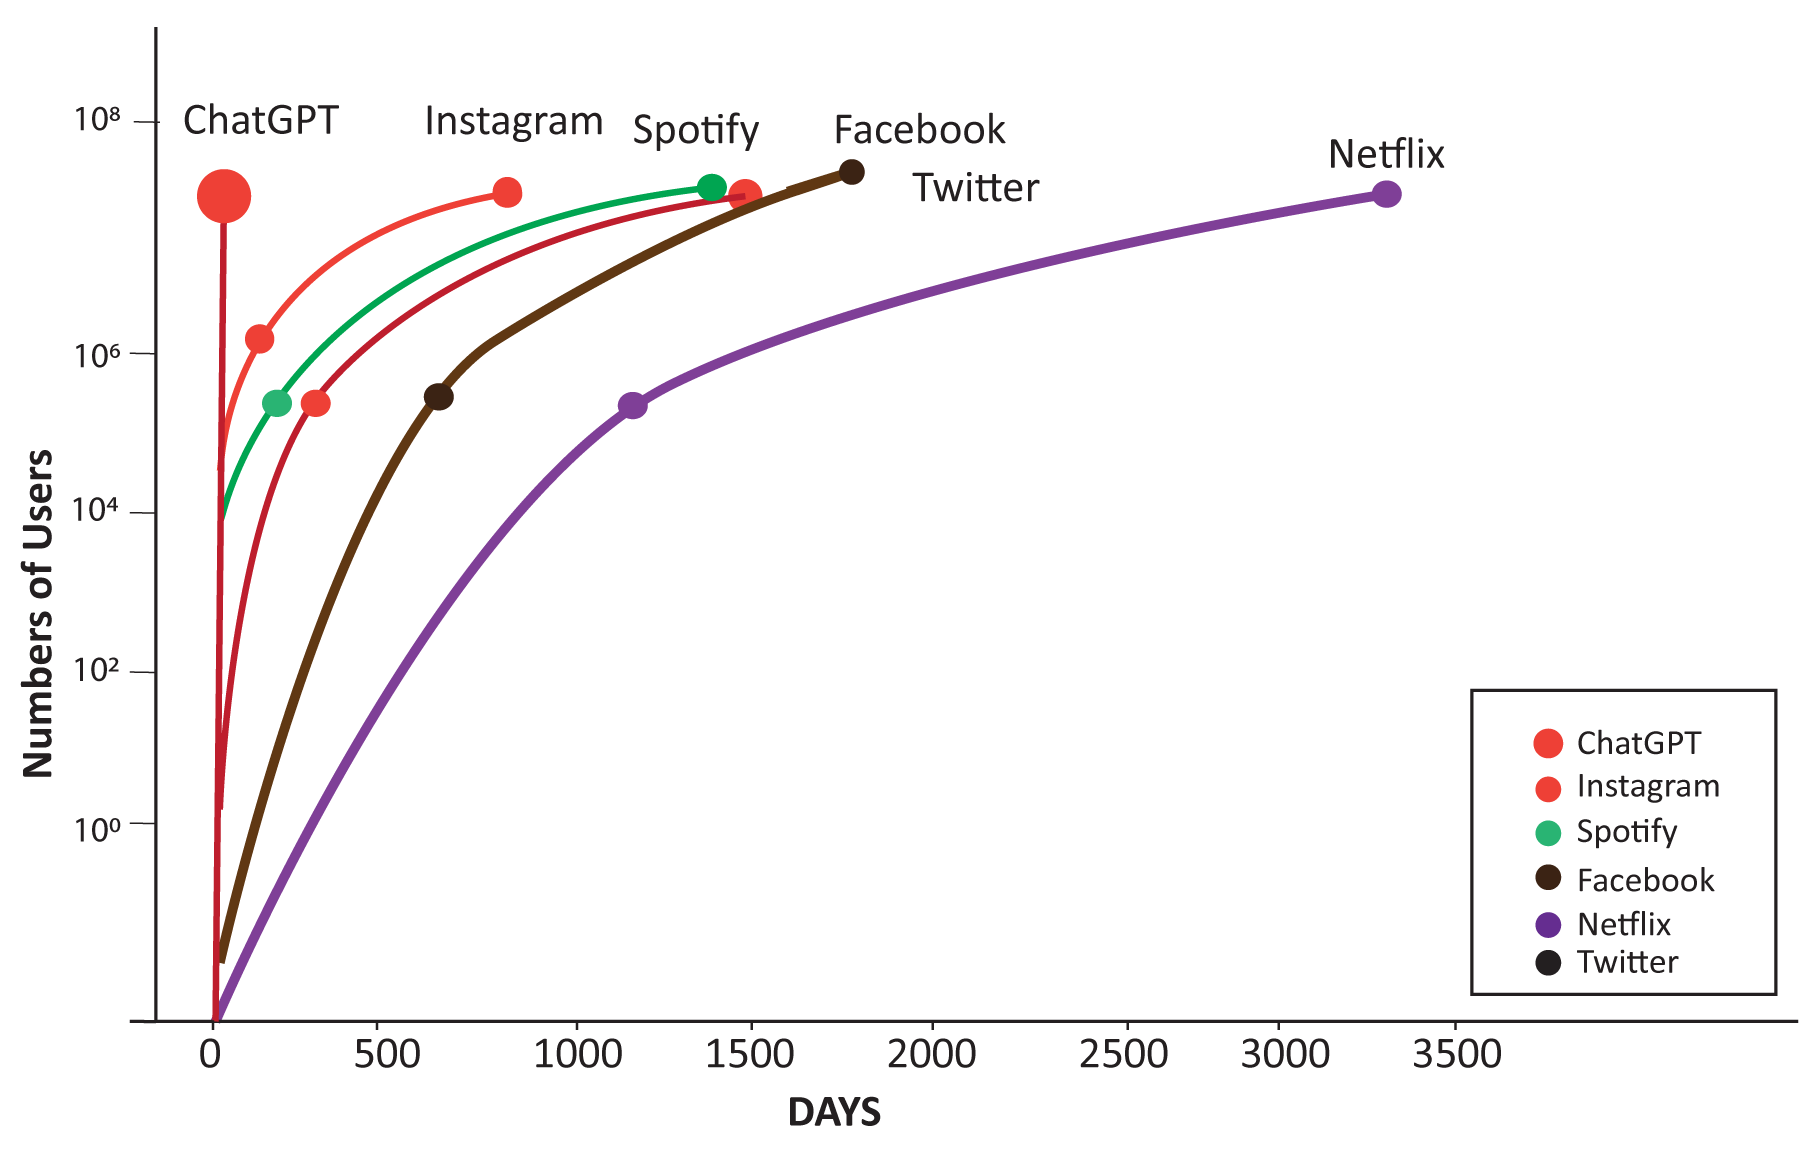
ChatGPT has made the term generative AI mainstream. But more importantly, it also saw the fastest user adoption ever, attracting 100 million users in just two months after its launch.
This is clearly a big deal, as we can see the meteoric rise of ChatGPT in the chart below compared to popular applications today like Instagram, Facebook and Netflix. Nothing else is quite like it. This growth was unprecedented.
# of days to 1M and users by technology
OCTOBER 21ST: PEAK PREDICTION
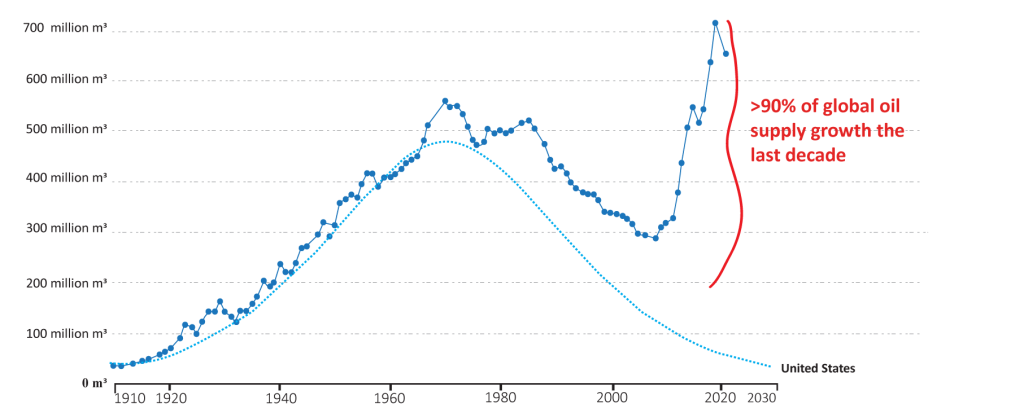
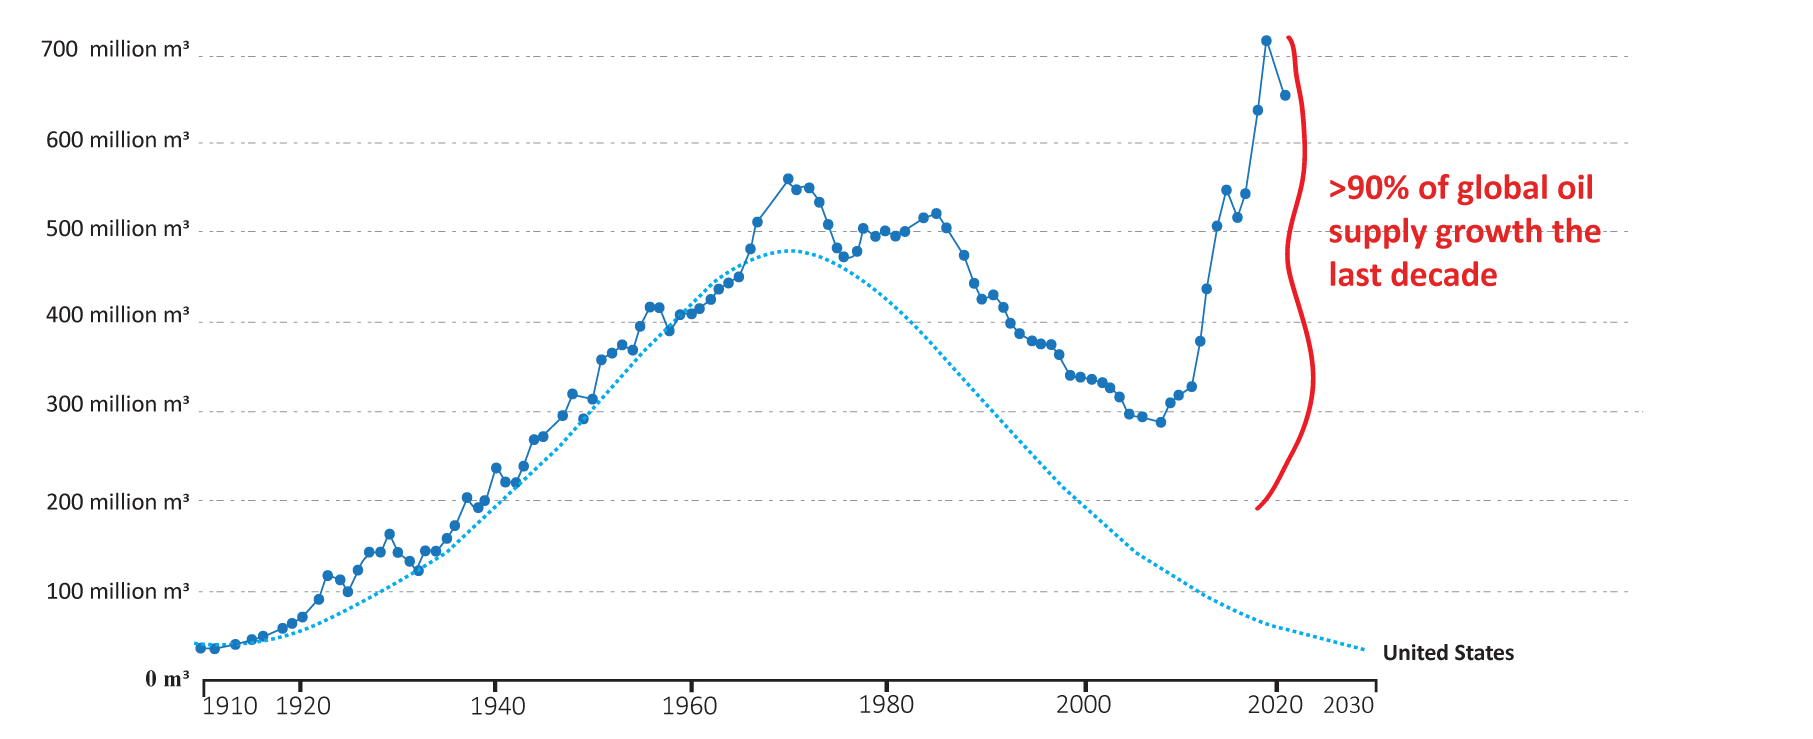
It was less than a decade ago, that hands were still wrung as to the foreseeable end of oil supplyies. Replacing conventional oil and gas’s historic decline rate, which fell to 4-5% per annum, was no small task, but the speed by which it arrested – and the implications for the global order, was not seen by many.
Shales’ arrival on the scene was timely, as it plugged the gap that was opening up between conventional supply and demand. What’s less understand was the magnitude – the US shales provided the energy equivalent of two Saudi Arabias with impeccable timing.
Hubbert’s peak prediction vs. actual oil production in the United States
Hubbert’s hypothesis of peak oil production in the United States, alongside actual oil production trends in the United States, both measured in cubic meters per year.
OCTOBER 14TH: THE NUCLEAR OPTION
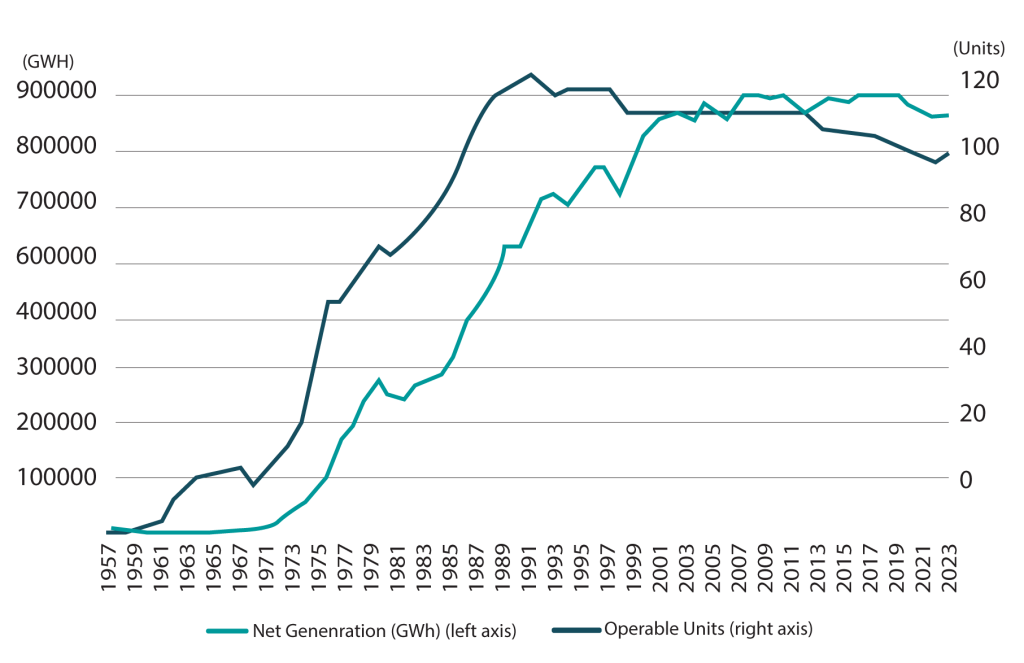
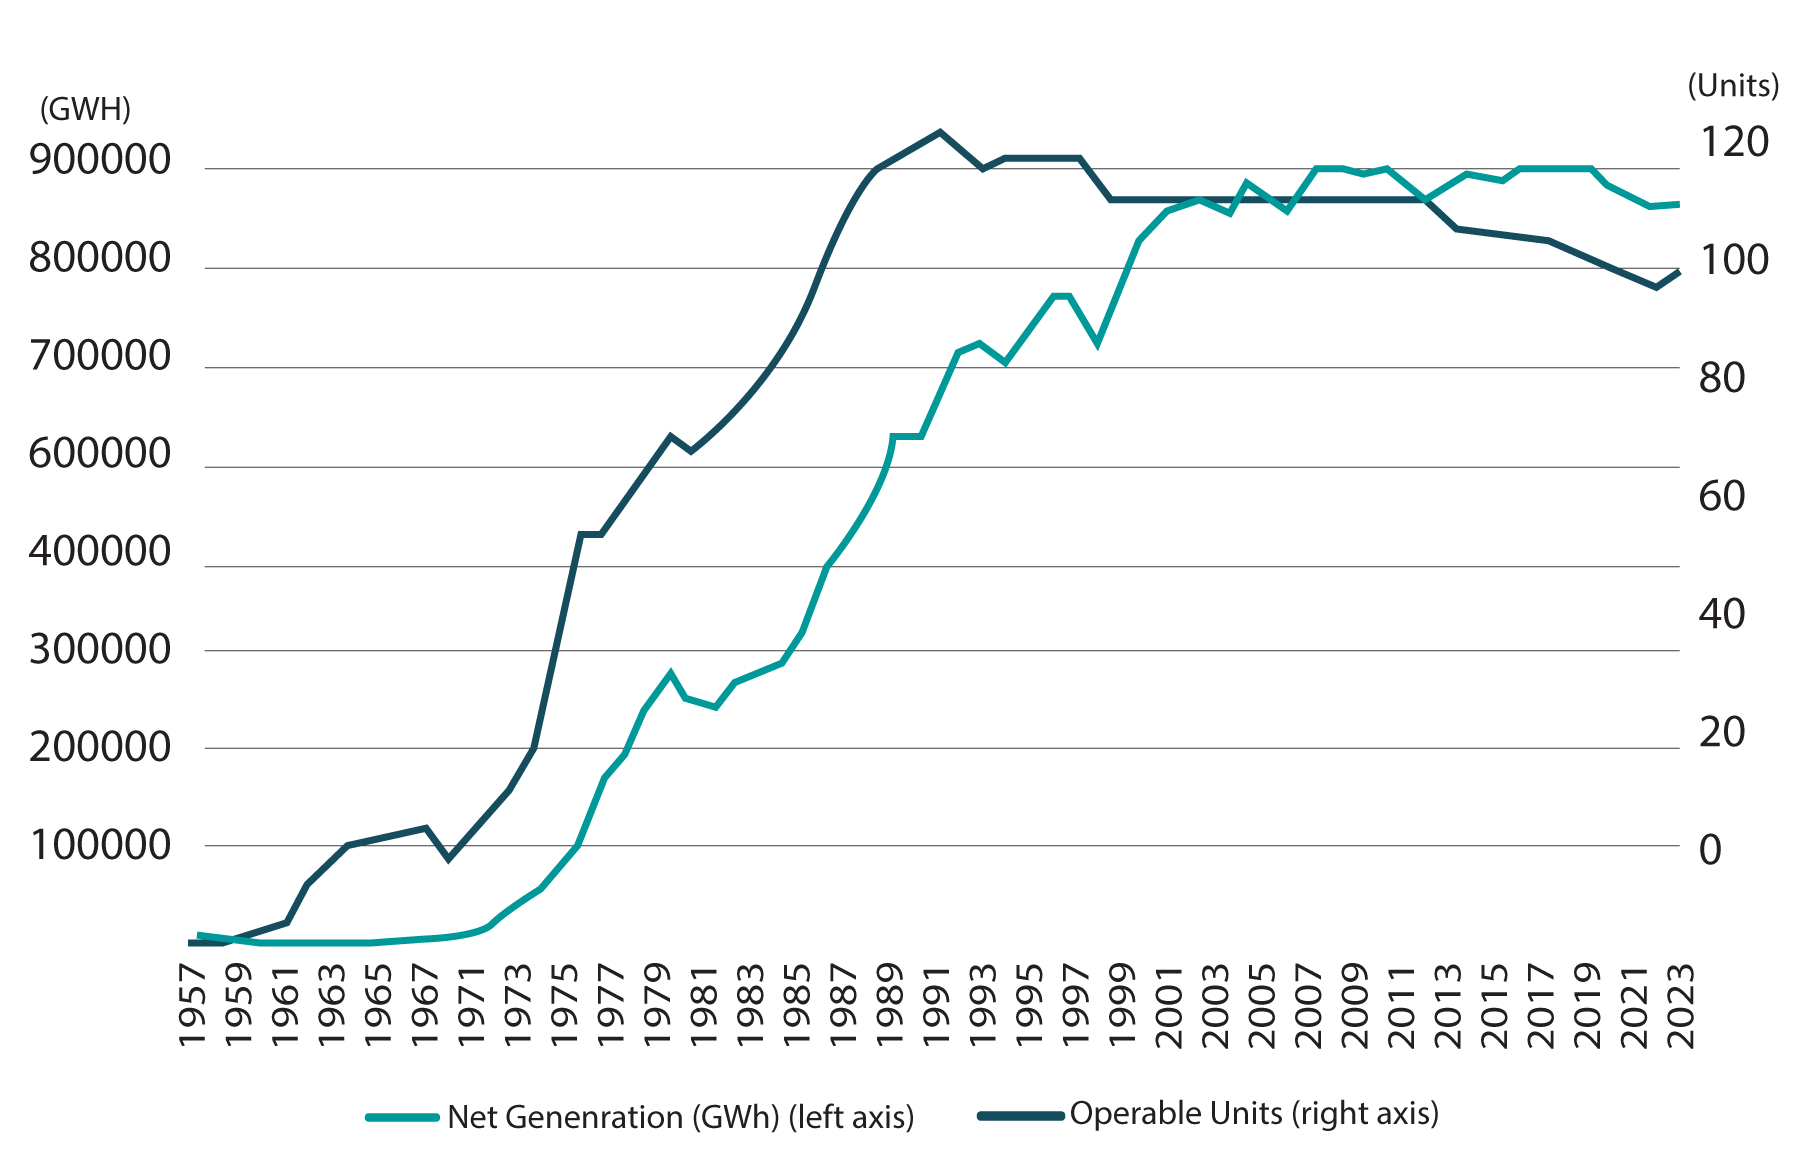
The nuclear power industry in the United States has been stagnant for over thirty years. The number of operable units peaked in 1987 and net generation has been flat since the late 1990s. The average operating U.S. nuclear power plant is 42 years old.
The two most recent new reactors, completed in 2023 and 2024 at Georgia’s Vogtle plant, were not driven by datacenter demands but instead marked the completion of a project than began construction in 2009, delivered fourteen years later at a total cost of over $30 billion for just 2,200MW of generating capacity. Until small nuclear reactors can deliver timely, reliable base load, renewables will continue to account for most load growth.
Nuclear Stagnation
OCTOBER 7TH: BRICKS AND MORTAR VS UK SHARES
The following considers whether investors are better to hold UK property or UK shares. As we can see, a longer time horizon shows three distinct periods. Share price outperformance in the 19th century, house price outperformance in the 20th, a more mixed picture in the 21st.
We can see how neither house prices nor share prices always go up, even over long time periods (although most of the time they do, and since 1945 they consistently have done, although this doesn’t account for inflation). In that respect the performance of both assets have tracked higher, with trailing 30-year returns rising steadily during the post war period.
Finally, since the turn of the century, 30-year returns for houses and shares have been quite similar, which may reflect the role of falling interest rates in driving all asset prices since the early 1980s.
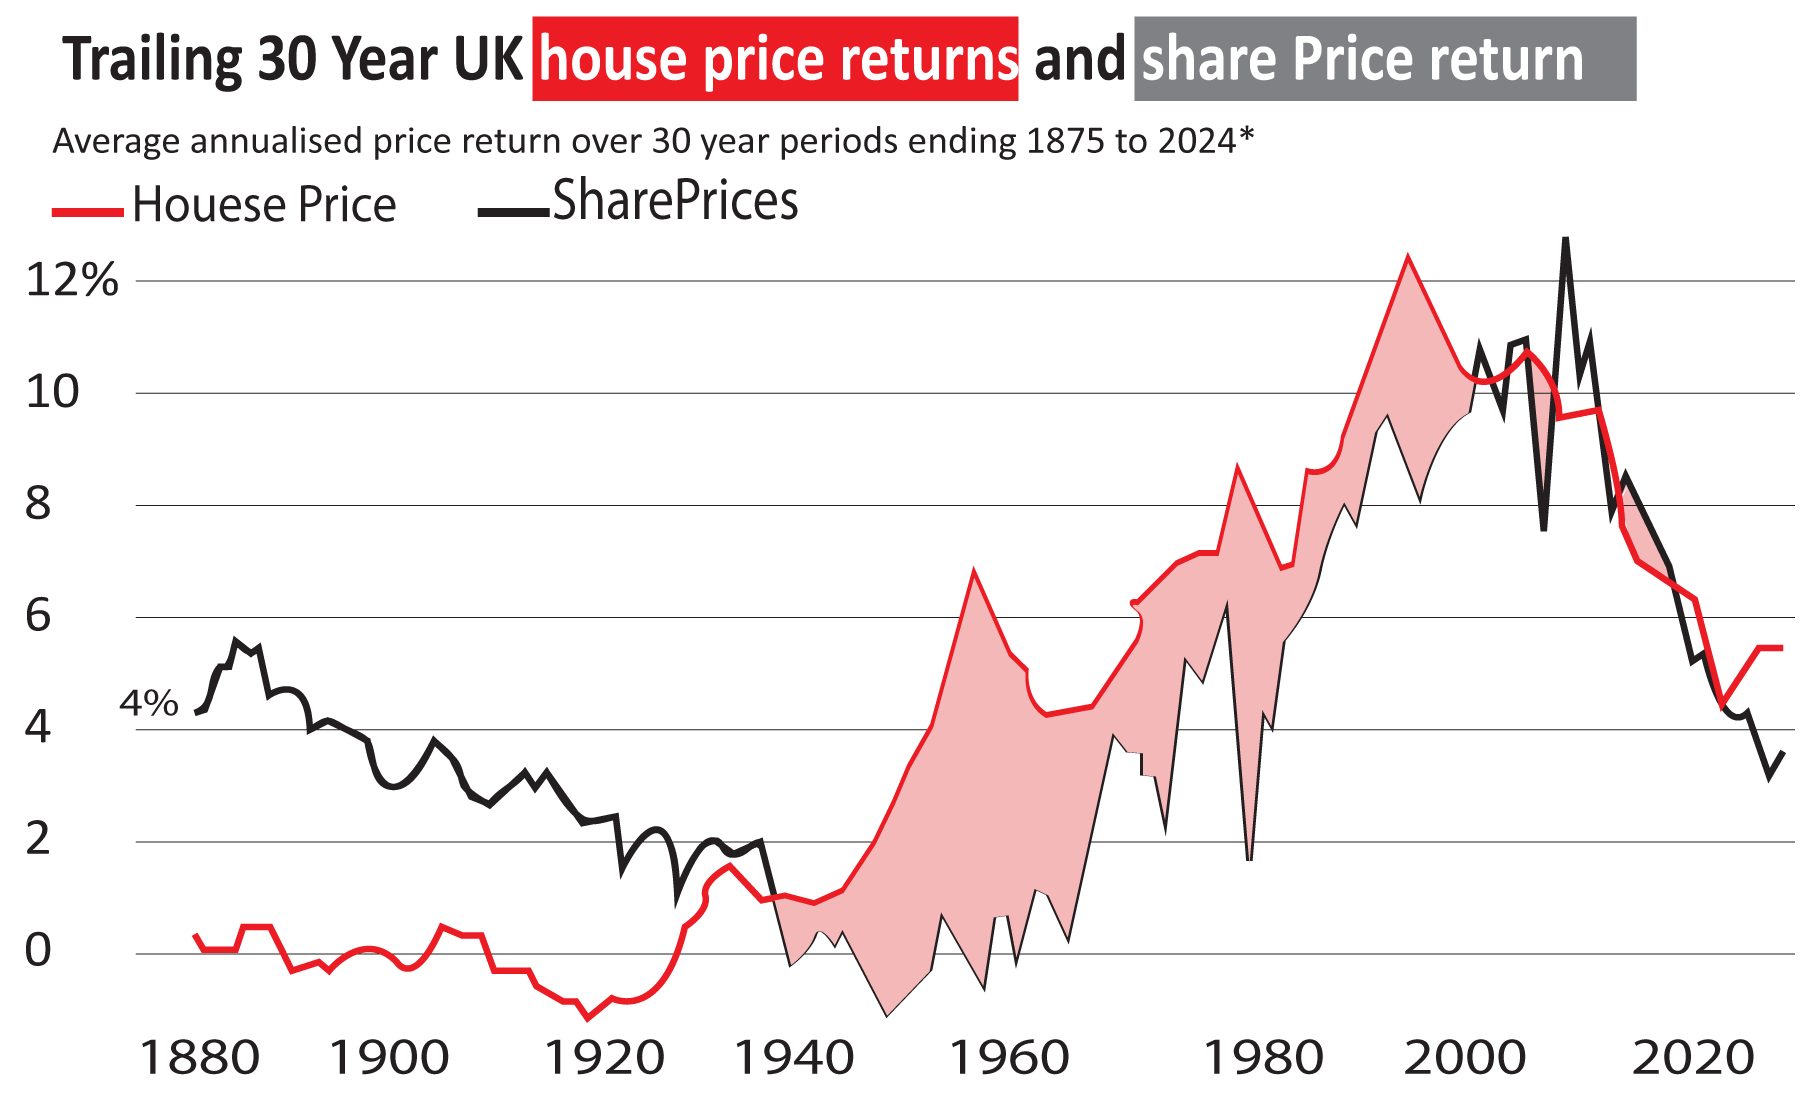
*Data from 1845 to 2015 is from the Bank of England. For 2016 to 2024 the share price series has been extended using price returns of The FTSE All Share Index. House price index has been extended using annual returns from the Land Registry: 2024 house prices are as of October 2024
SEPTEMBER 30TH: RELYING ON THE KINDNESS OF STRANGERS
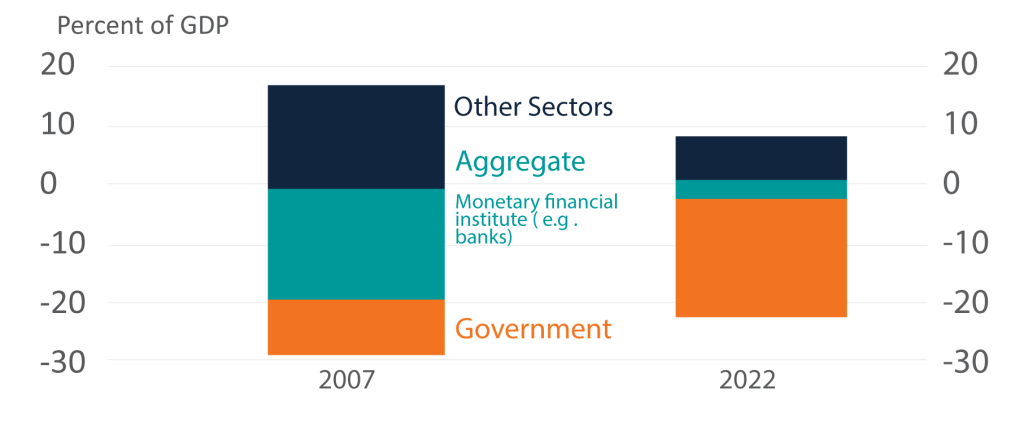
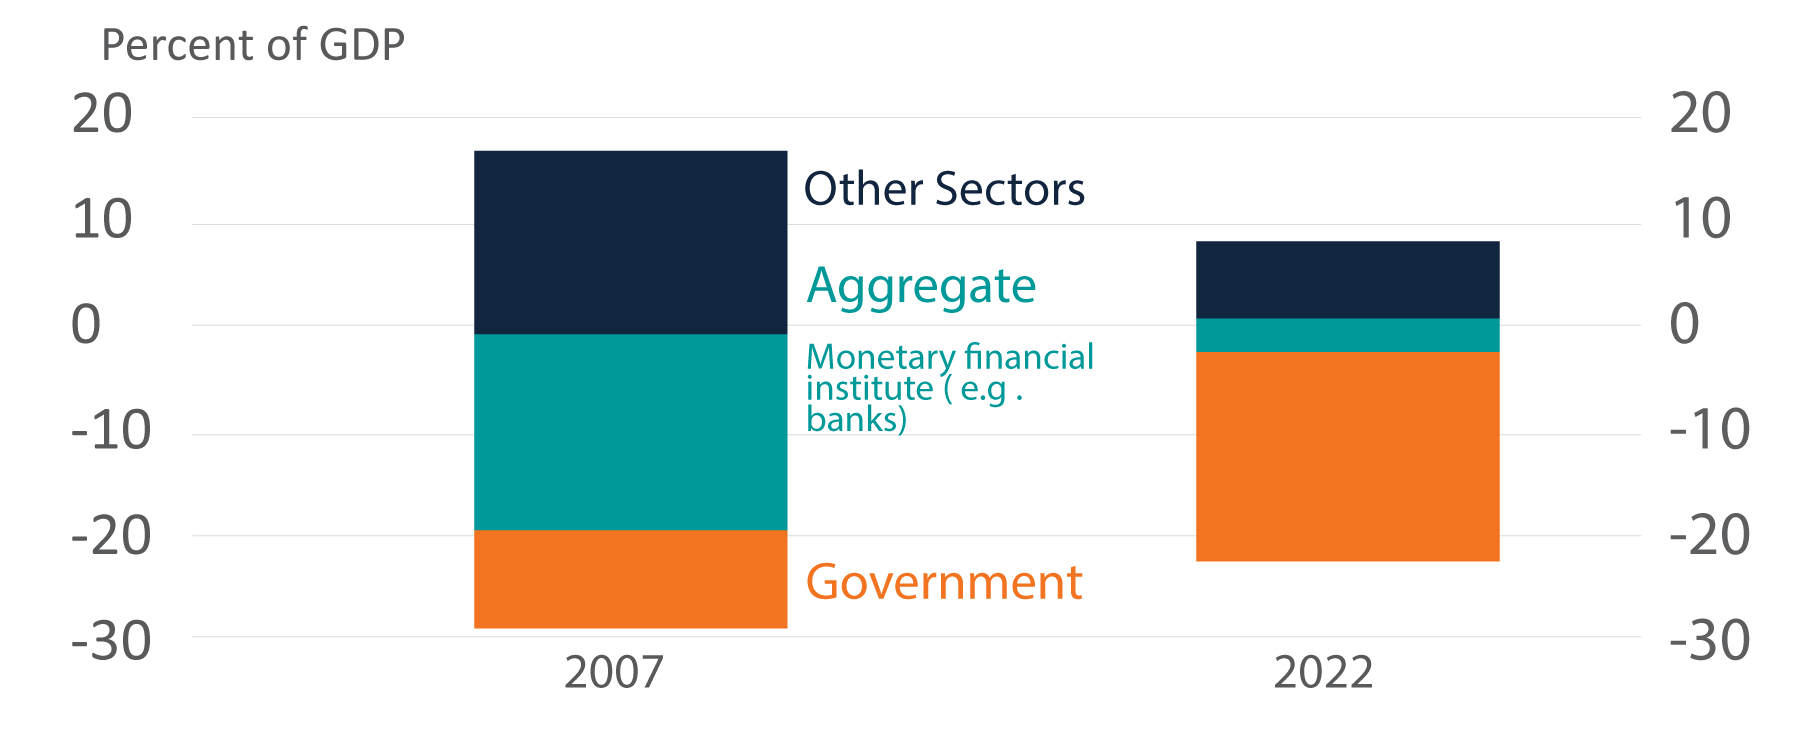
The UK has become increasing dependent on international investors to buy its government bonds. It wasn’t But that changed following the global financial crisis and above all Brexit, as the chart below from the Bank of England’s Bank Underground journal shows. Now if Brits are to continue to live beyond their means, we will need to fund the current account deficit by selling gilts to foreigners.
Post Brexit, banks have become a smaller percentage of GDP, and the Government a large proposition, which brings the reliance of Gilts used to fund government spend.
SEPTEMBER 23RD: ENERGY EFFICIENCIES
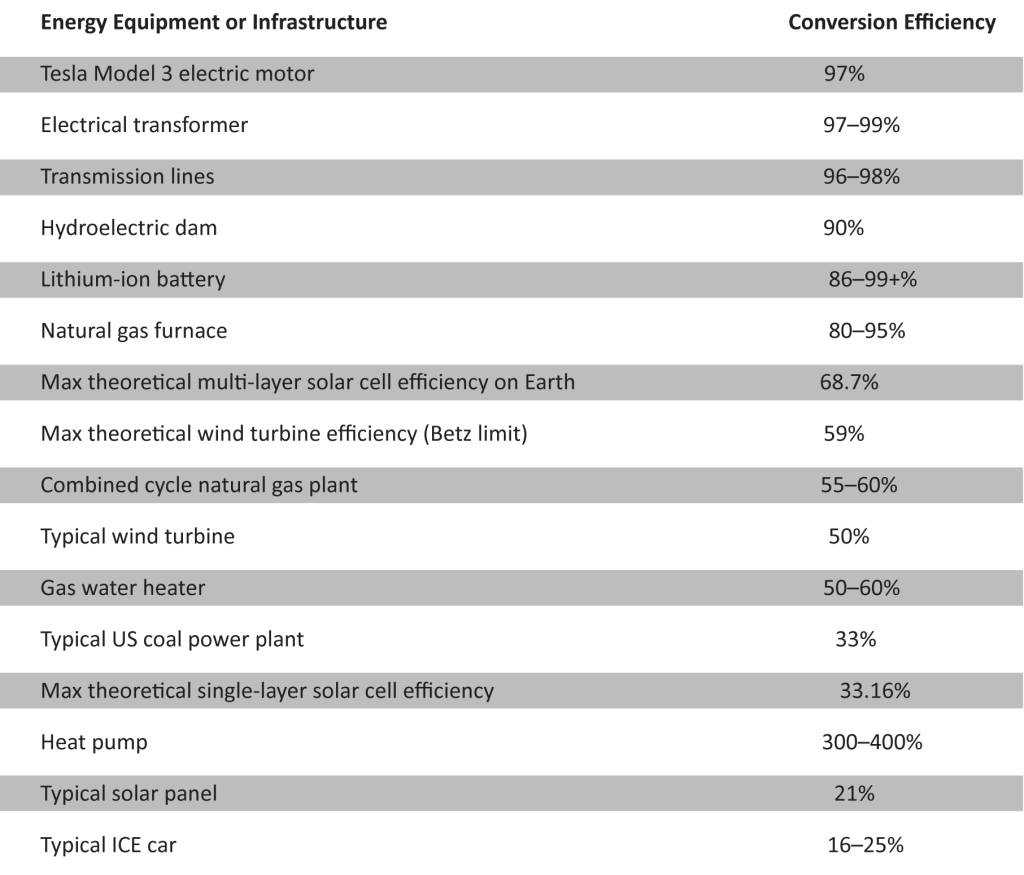
Moving electricity along transmission and distribution lines results in losses as some electrical energy gets converted into heat. Electrical transformers, which minimize these losses by transforming electrical energy into high-voltage, low-current before transmission, operate at around 98% efficiency or more.
The table show the conversion efficiencies of various pieces of energy infrastructure: The low thermal efficiency of ICE cars and heat engines in general and the high efficiency of electrical equipment (especially things like heat pumps) are the biggest counterweight to the high energy capacity of hydrocarbons.
Energy conversion efficiency
Conversion or transmission efficiencies of various pieces of energy infrastructure.
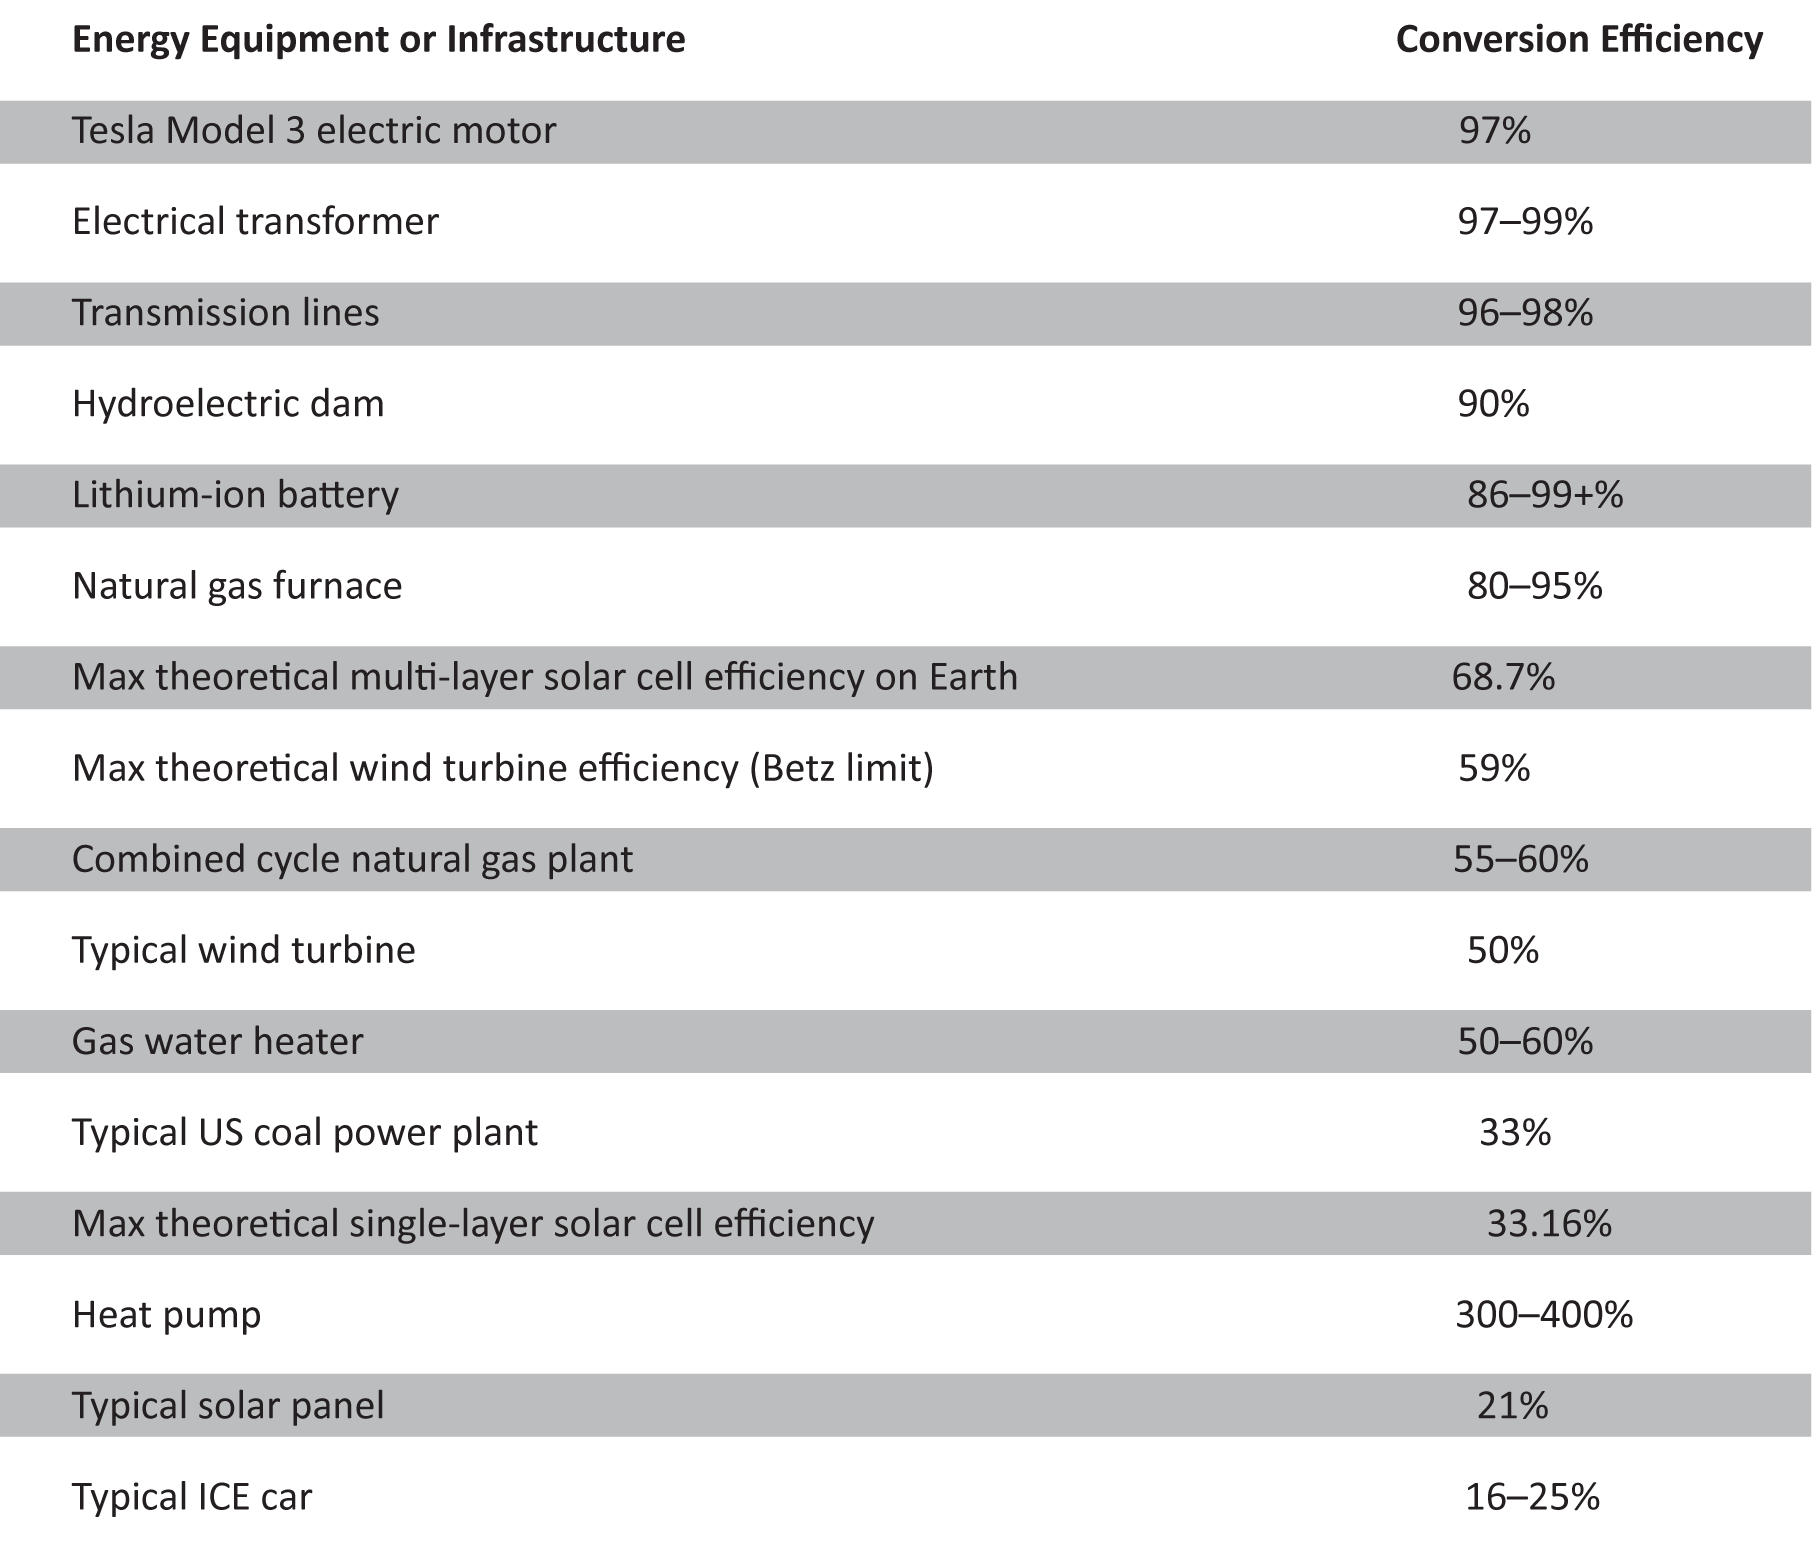 Source: IFP, ARIA
SEPTEMBER 16TH: DEEPER DELVE: THE LEVEL OF INFLATION AND HOW BONDS AND EQUITIES PERFORM IN CONCERT
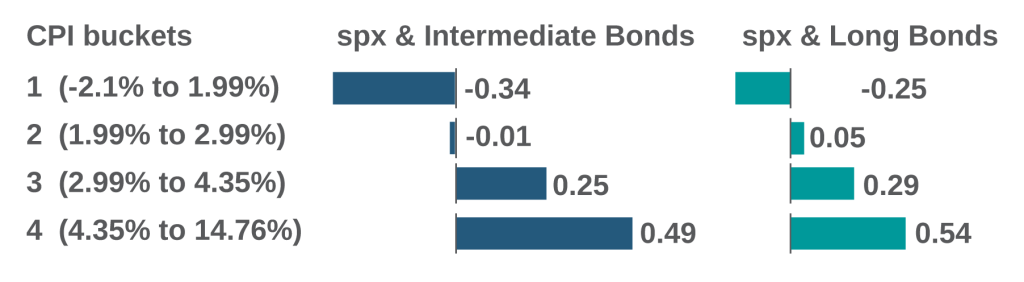
Bonds and their role as portfolio hedges are pivotal to portfolio asset allocation decisions. However, bonds do not always rally, when equities fall, and vice versa. Instead, the relationship is a little more nuanced than that, and is significantly influenced by how high inflation is. As per the table above, when CPI is below 2% or even negative, stocks and bonds are negatively correlated – giving rise to the 60/40 portfolio and bonds acting as a “portfolio hedge”. When inflation is 2-3%, that relationship breaks down, but beyond that, in highly inflationary times, when inflation is >4.35%, stocks and bonds are positively correlated and it is very tough sledding for both.
The correlation of stocks and bonds depending on the level of inflation (as measured by the Consumer Price Index – CPI)
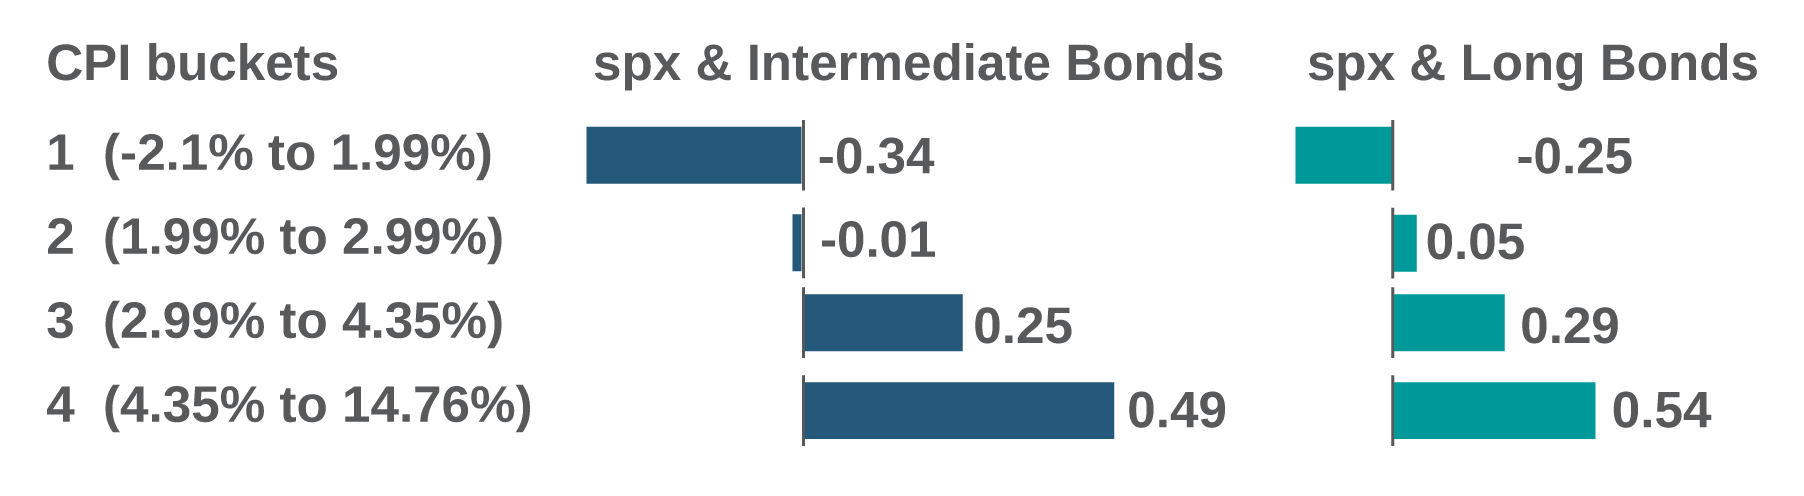 Source: Thundersaid Energy
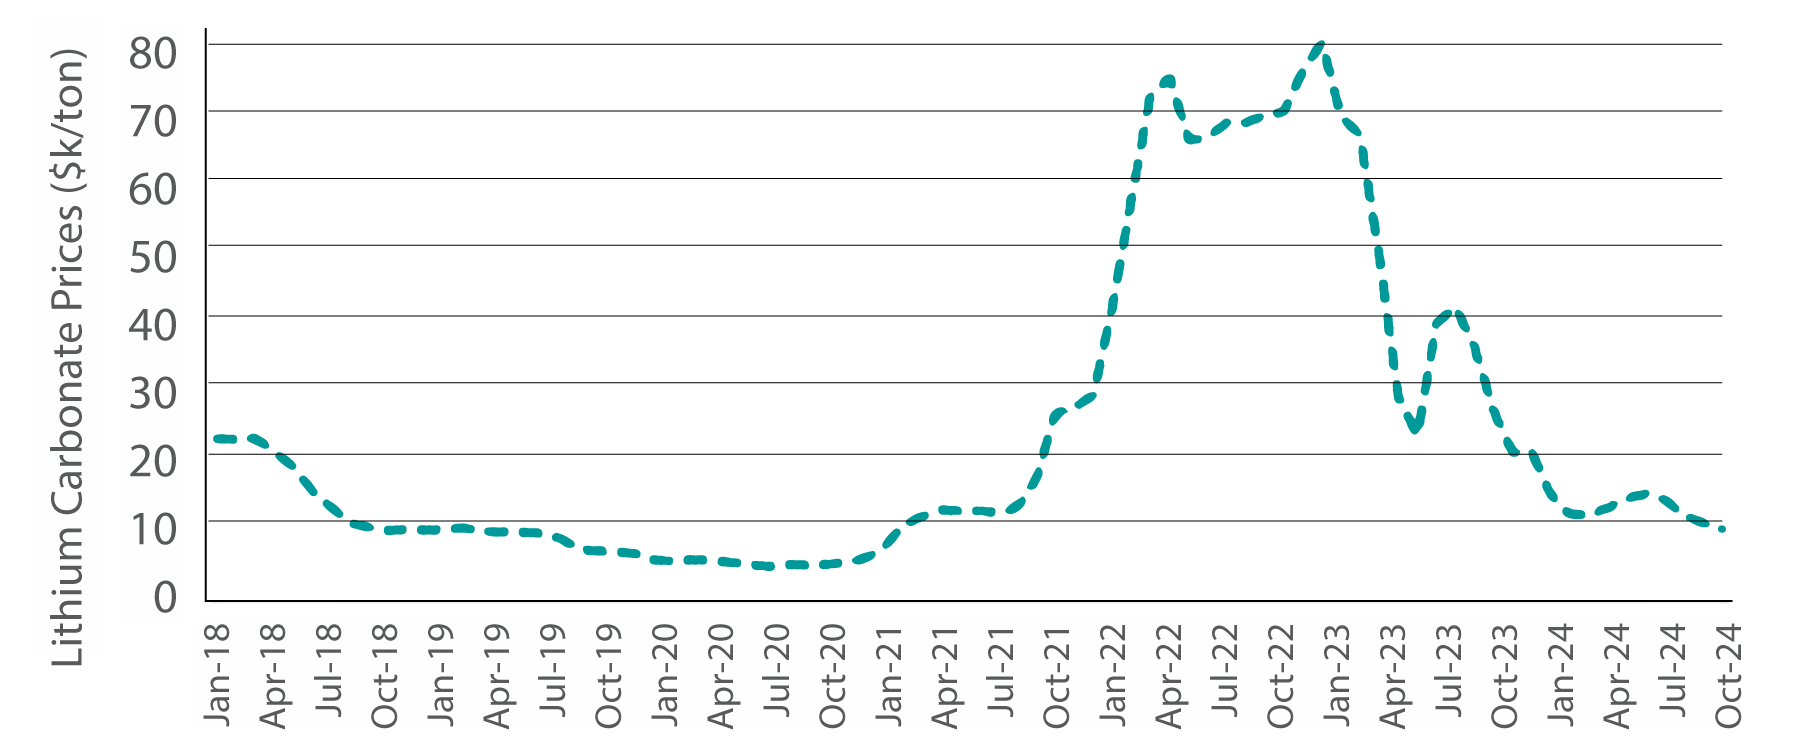
SEPTEMBER 9TH: GLOBAL EV OUTLOOK AND LITHIUM CARBONATE
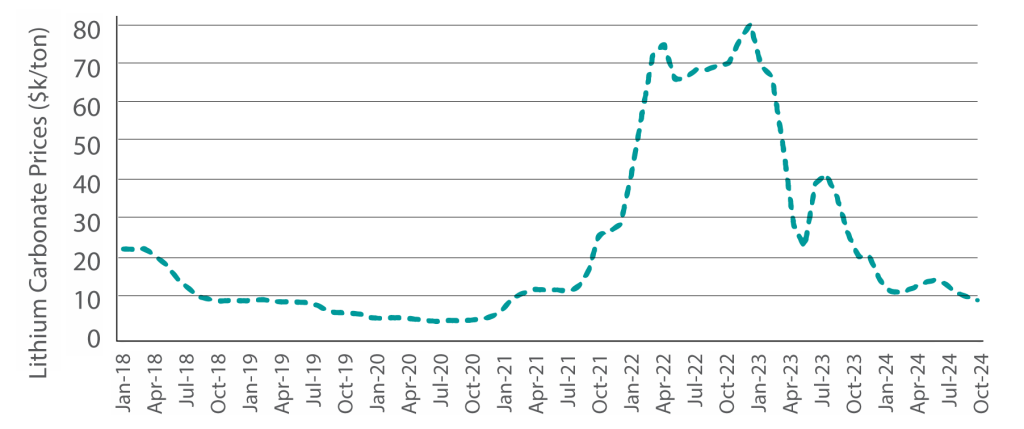
It’s widely reported that EV sales globally are on a tear. Since 2019 indeed, every year has seen a significant increase. Only in the first quarter of the year, sales grew by 25% compared to the same period in 2023. Moreover, we’re predicted to see 17 million in sales by the end of 2024. Electric cars could account for 20% of total car sales by then. The IEA sees a great growth potential, especially outside of the core markets of China, Europe and the USA.
However, prices for lithium carbonate, (and inevitably heavily influenced by supply), have been going in the other direction – might sales going forwards not be at such a blistering pace?
Chinese Lithium carbonate prices have collapsed
 Source: Thundersaid Energy
SEPTEMBER 2ND: ROLLING CORRELATION BETWEEN STOCKS AND BONDS
Bonds have historically been the defenders in the football teams that are portfolios. When equities fells, typically bonds rallied, providing stability in returns. That was the case for 30 years at least, until recently for nearly 30 years. However, before that, we had a 30 year periods were by equities and bonds both rallied and fell together – and during a higher inflationary regime. The question is what is before us? Do we return to a positive correlation, or was Covid inspired supply chain shortages and commensurate inflation, a shorter term diversion.
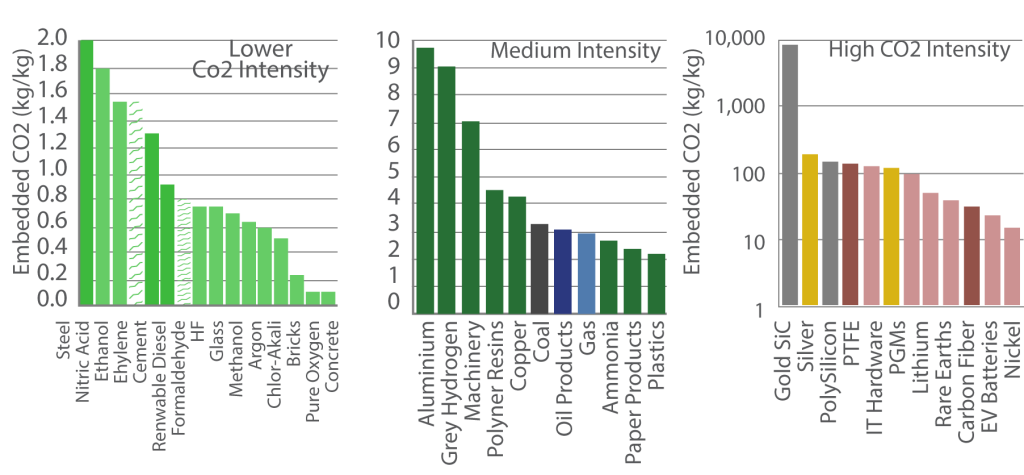
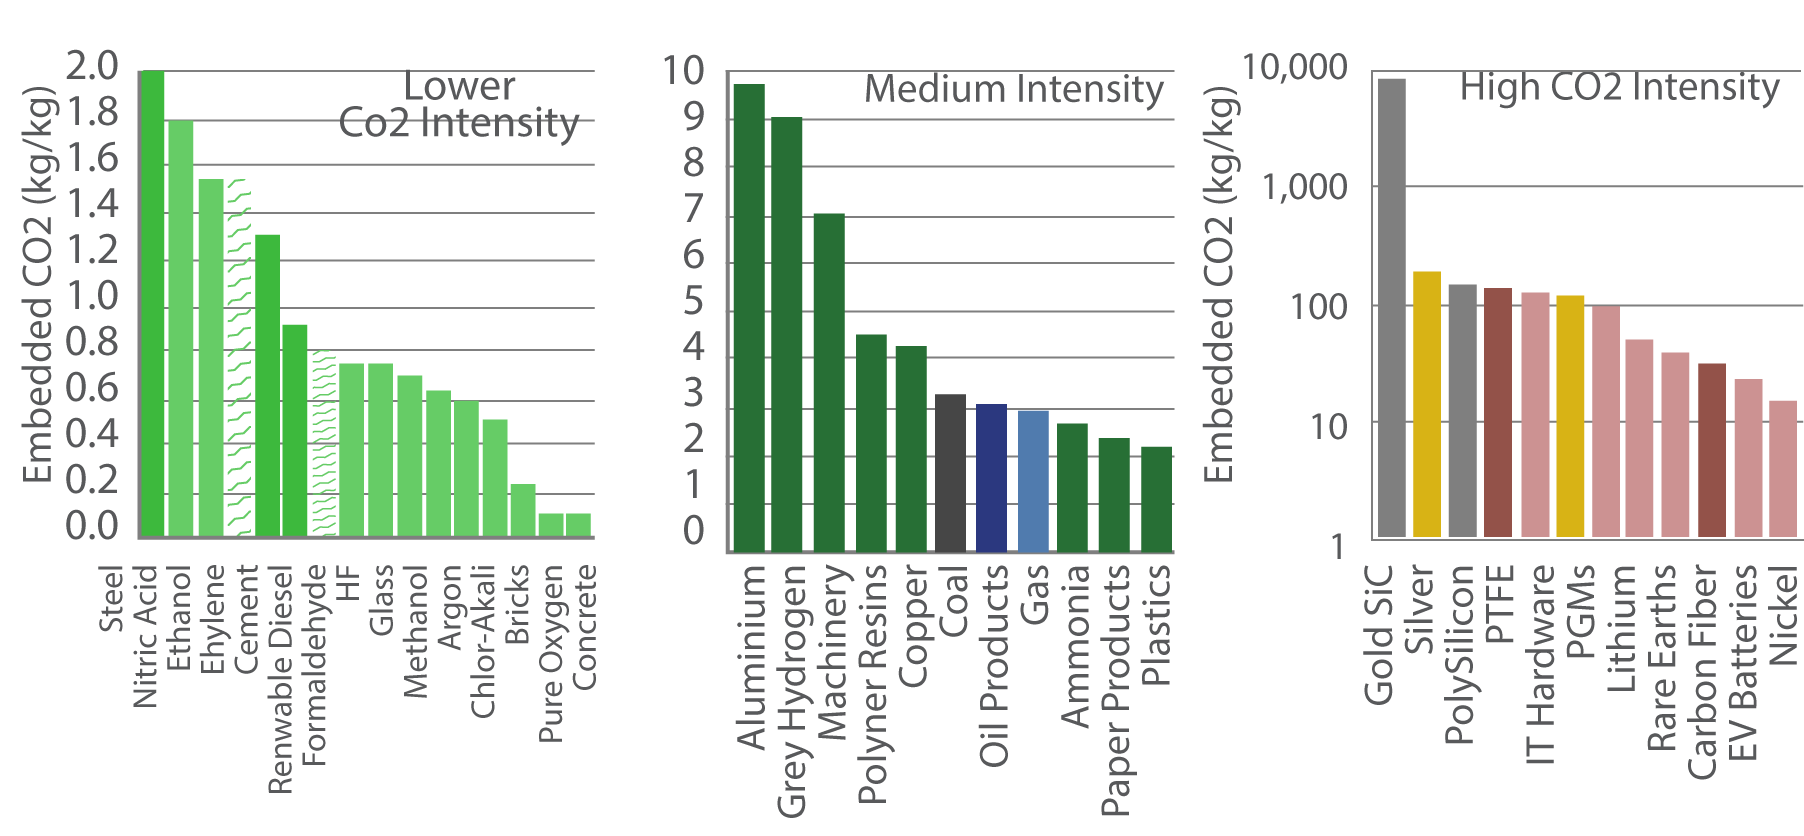
AUGUST 26TH: ENERGY AND CARBON INTENSITY OF EVERYDAY MATERIALS
Comparing the CO2 intensity and energy intensity of materials, many used in our daily lives appear to be ‘less expensive’ in terms of the resources they take to produce. That’s to say when measure in tons/ton of Co2, kWh/ton of electricity and kWh/ton of total energy, EV batteries,. Lithium can be very costly to produce when compared to methanol or concrete
Co2 intensity of materials
 Source: Thundersaid Energy
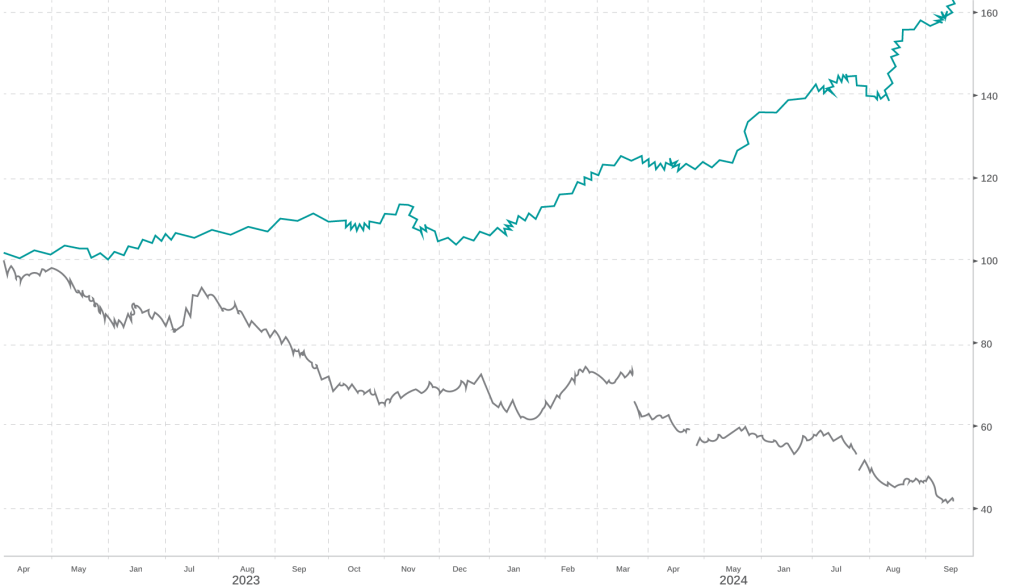
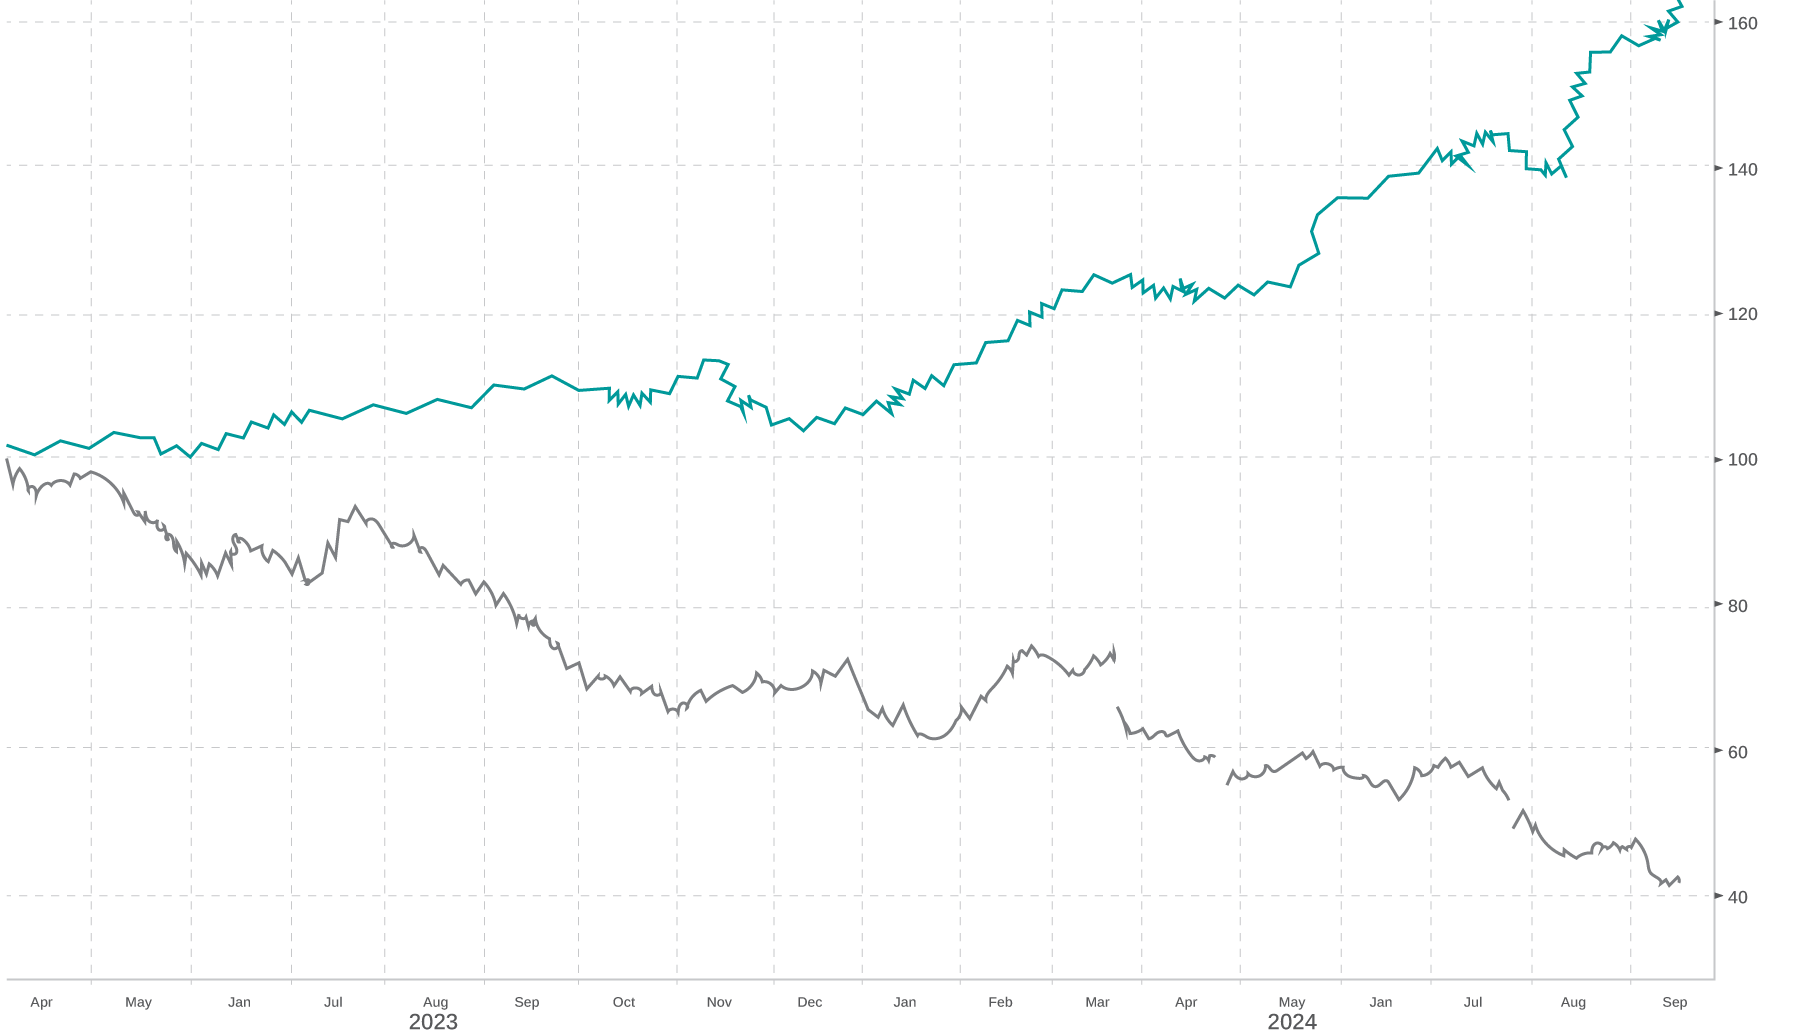
AUGUST 19TH: THE BEST OF TIMES THE WORST OF TIMES
perhaps if the global slowdown was to be believed, then this would support it. As global consumer perhaps pulls in its horns, Kering SA, listed in the EU and owning brands such as Gucci and Yves Saint Laurent has a had tough time compared to Walmart in the US – a discount retailer known for its miserly prices.
year performance of Kering SA versus Walmart
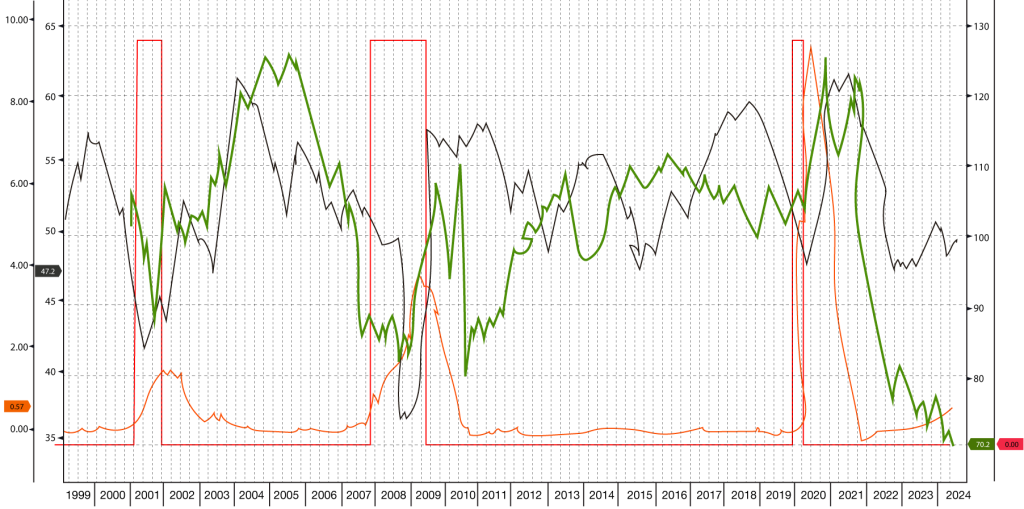
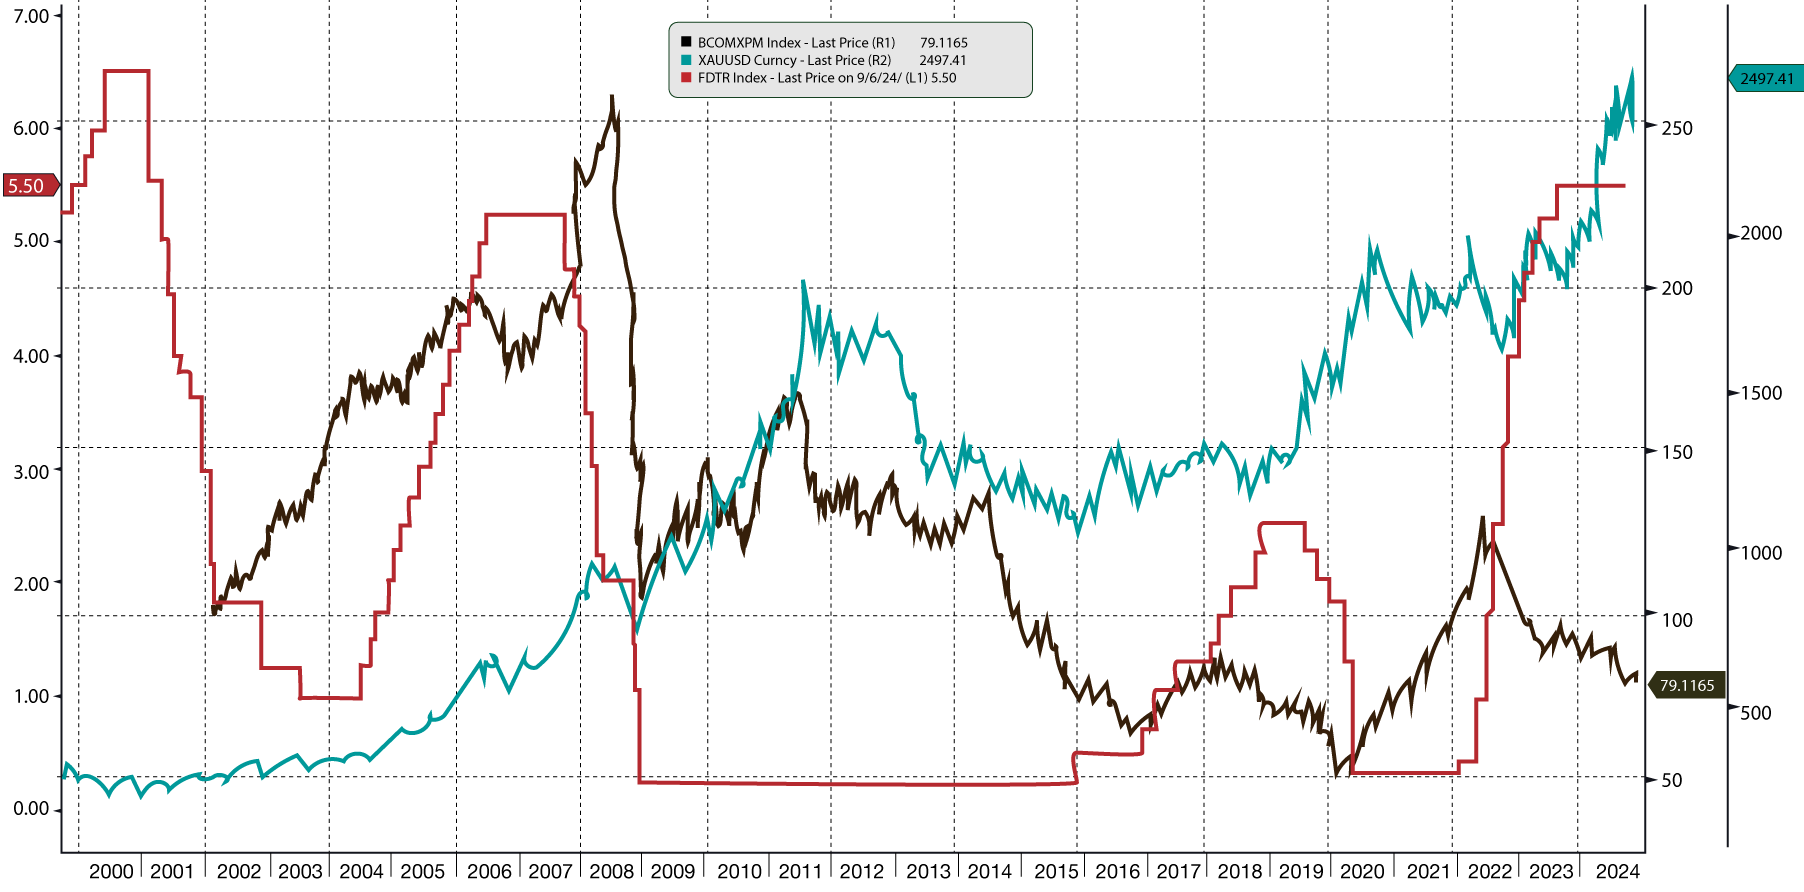
AUGUST 5TH: LOWER RATES, HIGHER COMMODITIES?
It’s often held that as interest rates are lowered by Central Banks, and particularly in respect of the US Federal Reserve and the green back, commodity prices rally – alongside other asset classes such as bonds and property. During the last three cutting cycles – show where the purple line is falling 2001, 2008 and 2020 grains, oil, metals and Gold have all responded differently. Of course, each cycle has had different rationales for lower rates. Most obviously gold seems to respond to lower interest rates most positively, yet oil and metals, tied to the economic cycle are less likely to benefit, as having fallen in each period of lower interest rates.
Grains, Metals, Gold and Crude Oil – performance in cutting cycles
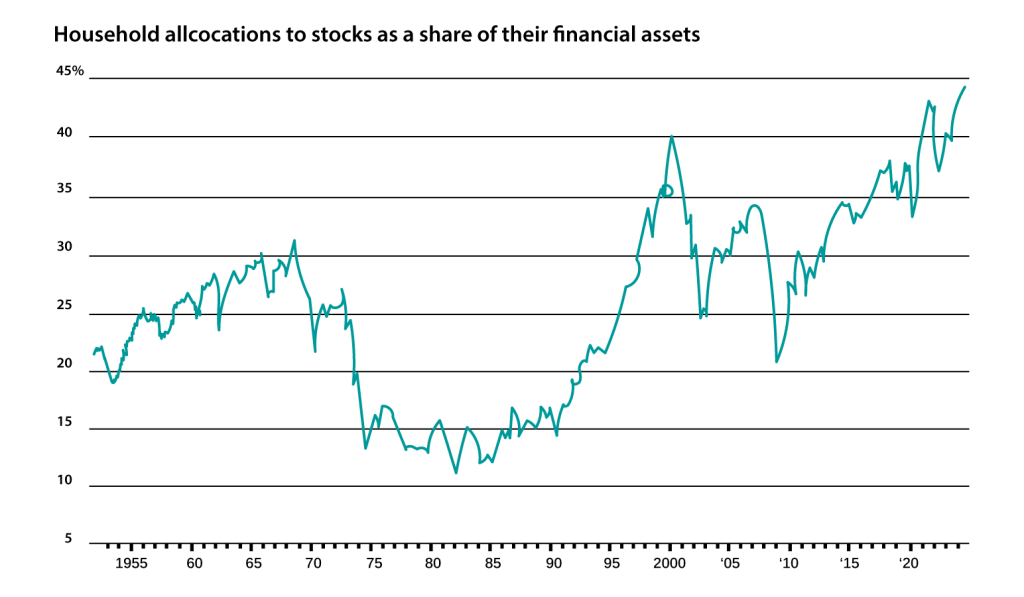
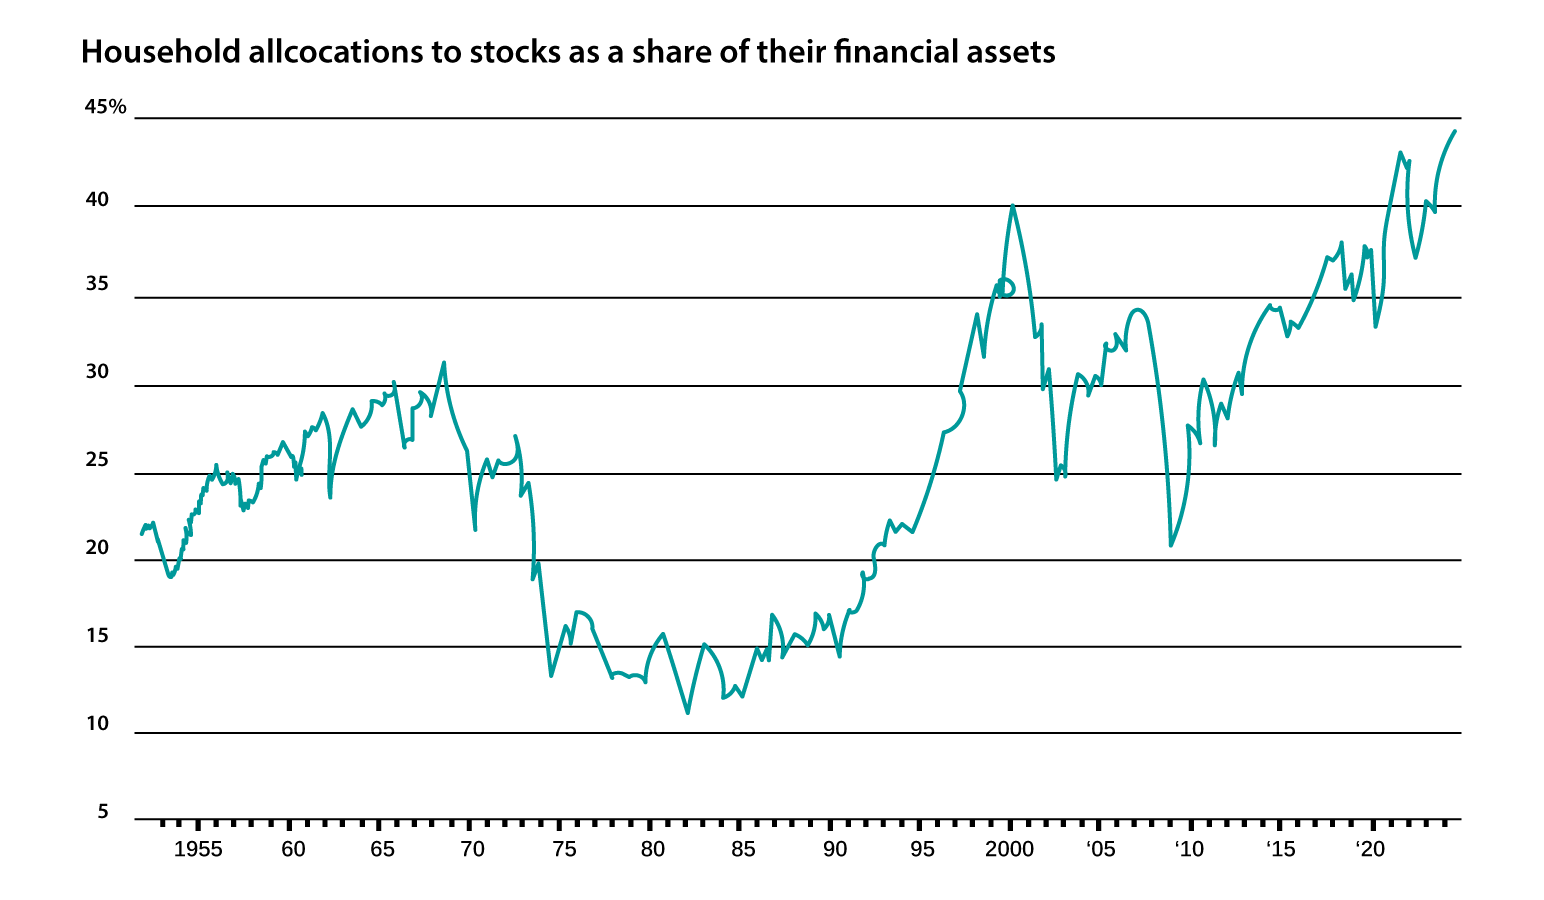
JULY 29TH: NEARING THE END OF THE BULL? OR SIGNIFICANT GAINS AHEAD?
Household stock allocations have reached an all-time-a clear sign that the bull market, ongoing sine 2009, may be in its absolute late stage.
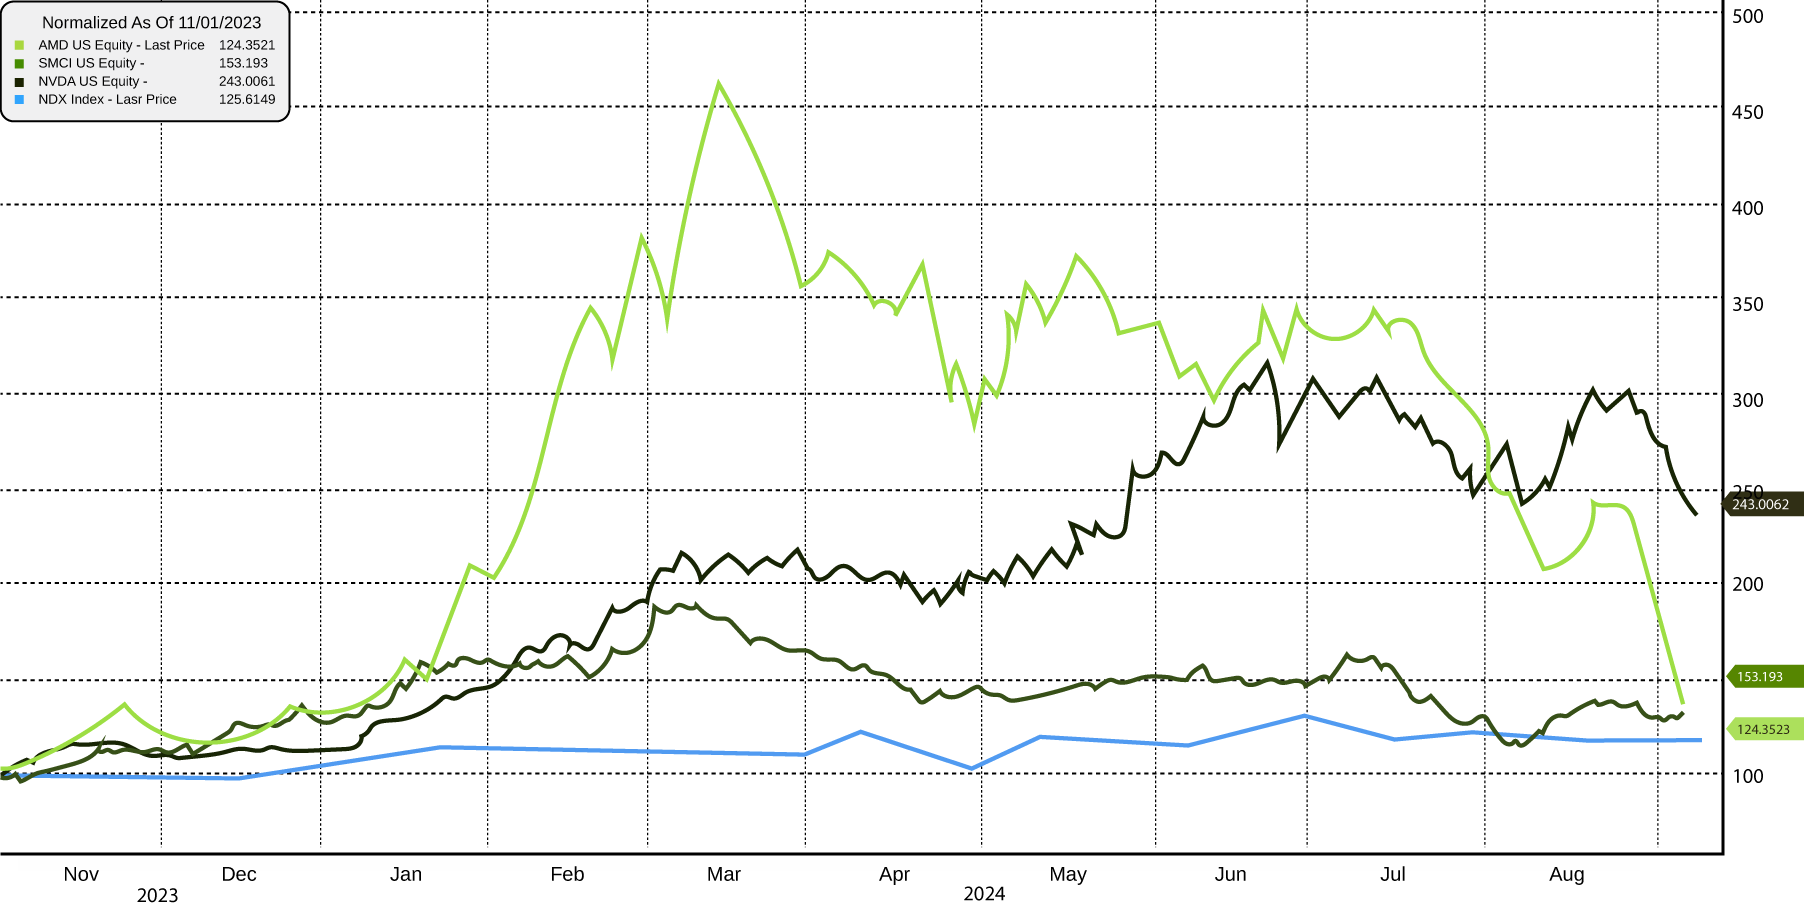
JULY 23RD: DIGITAL DOMINOES
Chart showing 2024 YTD price action and AMD, SMCI, NVIDIA and ultimately the Nasdaq topping in sequence.
Source: ARIA
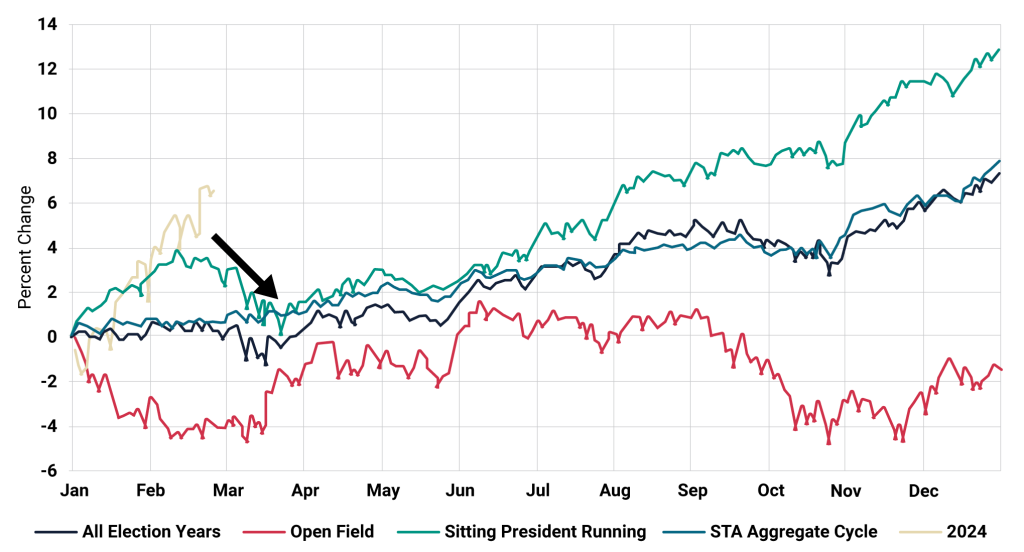
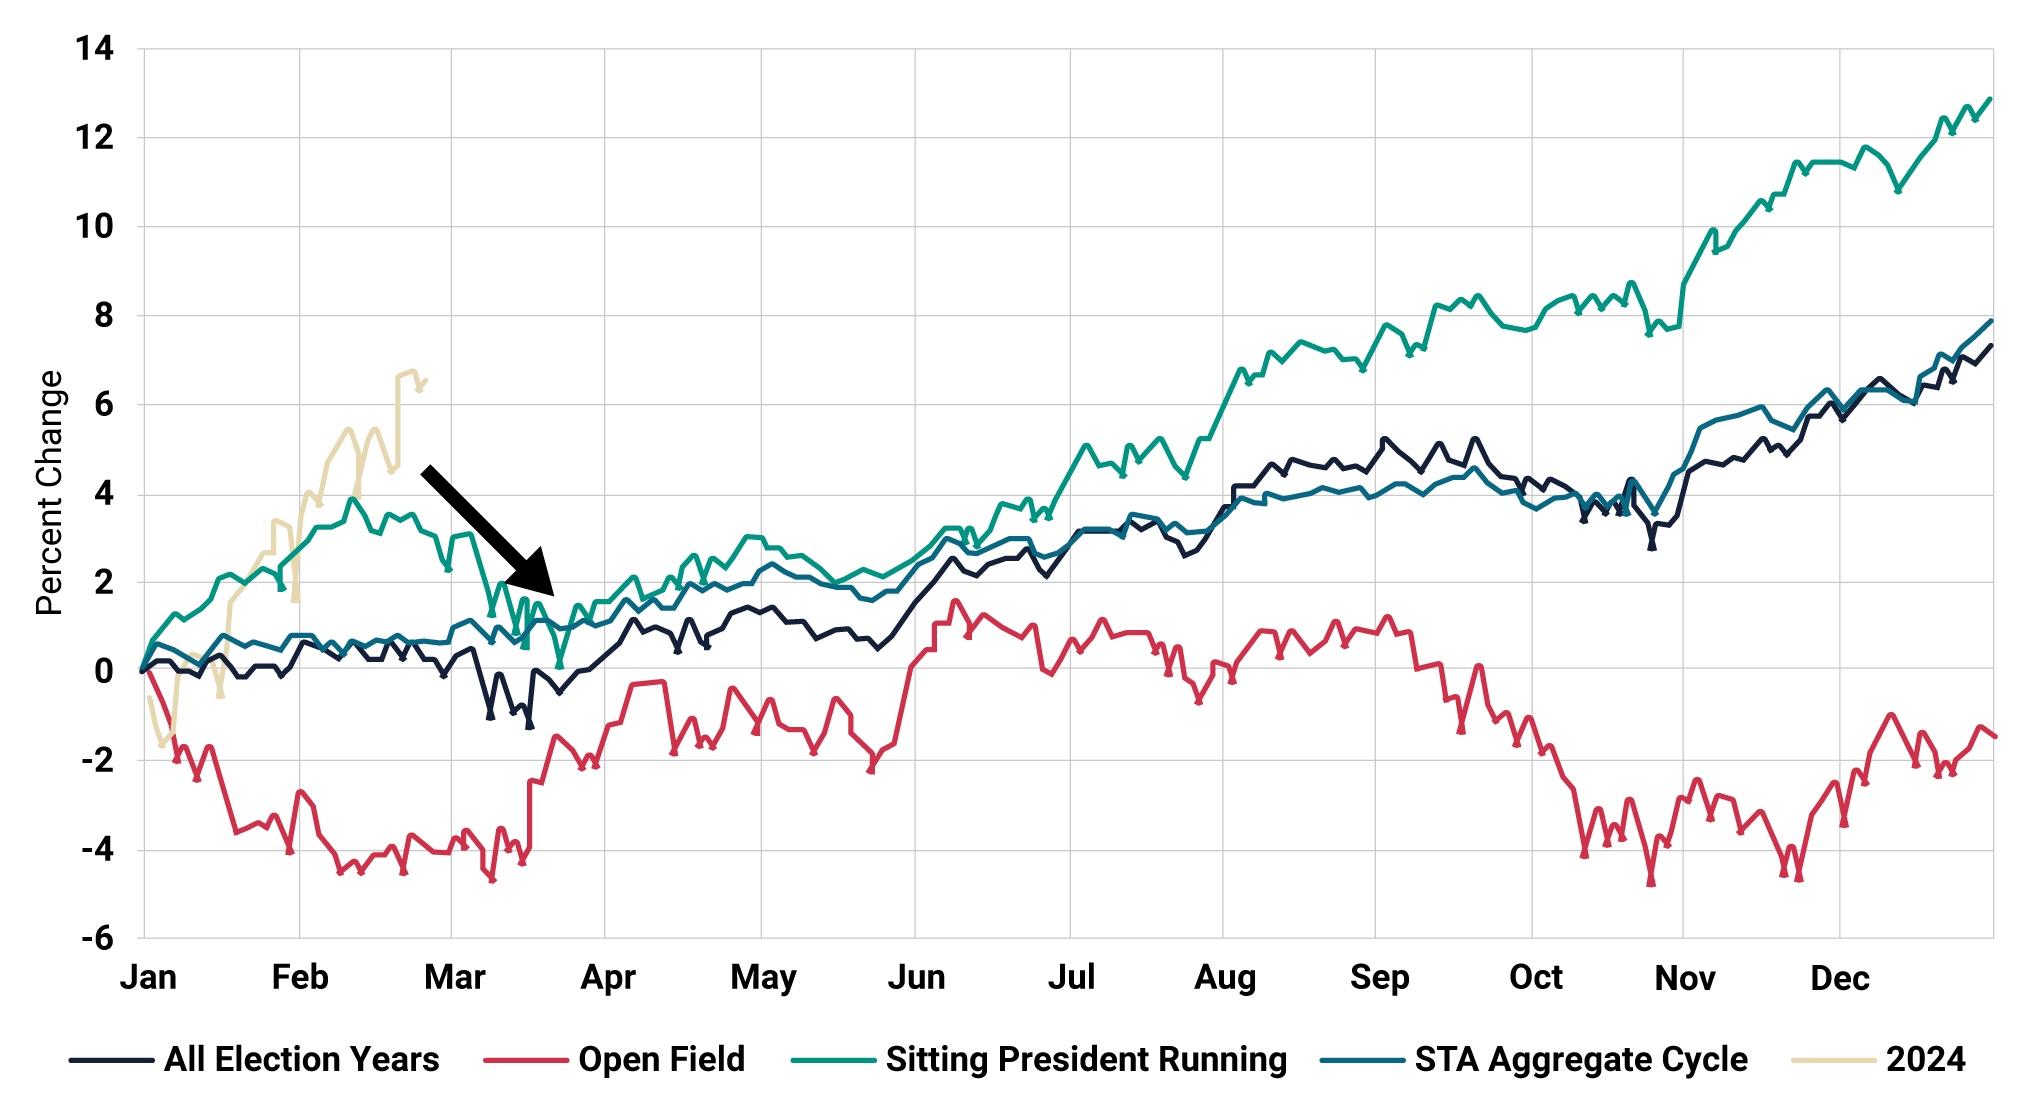
JULY 15TH: HISTORICAL ELECTION YEAR PATTERNS
Historically, ‘Sitting President Running’ Election years are strong performers, and 2024 has been no exception. The seasonal pattern below confirms just that. However, with now a greater degree of uncertainty, it is very possible that we fall into the ‘open field’ pattern as recorded below as the Democrats look to switch their Presidential candidate.
Seasonal Patterns in Election Years
 Source: Almanac Trader, ARIA
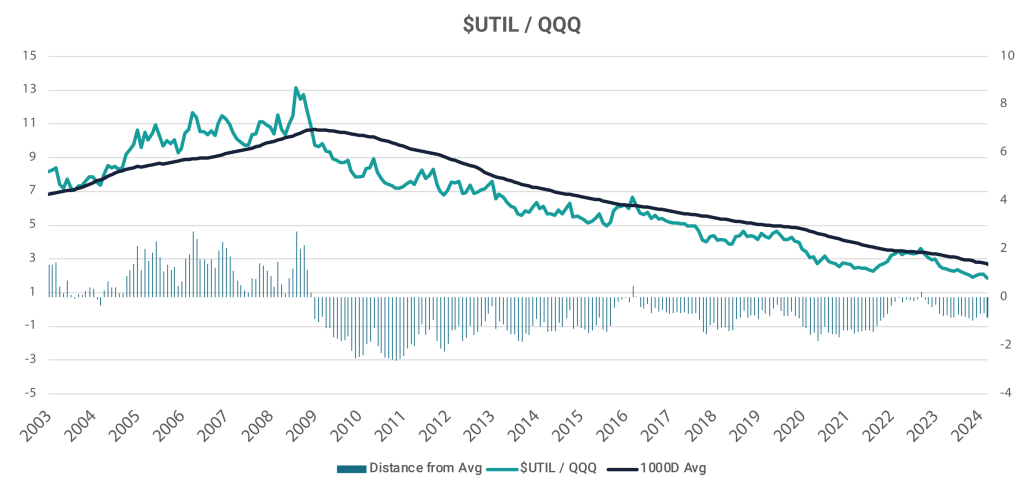
JULY 8TH: EXTREME RELATIVE OVERVALUATION IN TECH VERSUS DEFENSIVE EQUITY SECTORS
Such asset allocation changes include utilities and consumer staples sectors, which have been out of favour for some time. The below chart shows perhaps that that tide has turned, and specifically markets may for a period of time take on a more defensive leadership. A housing and retail led slowdown is long overdue.
Performance and valuation discrepancies between defensive and growth sectors is at an extreme
 Source: ARIA, Bloomberg
JULY 8TH: EXTREME RELATIVE OVERVALUATION IN TECH VERSUS DEFENSIVE EQUITY SECTORS
Such asset allocation changes include utilities and consumer staples sectors, which have been out of favour for some time. The below chart shows perhaps that that tide has turned, and specifically markets may for a period of time take on a more defensive leadership. A housing and retail led slowdown is long overdue.
US Federal Reserve Balance Sheet as Percentage of GDP
Source: ARIA, Bloomberg
JULY 8TH: FED HAS COMPLETED ITS LIQUIDITY DRAIN.
Whilst central banks have been reducing their post pandemic bloated balance sheets, it has been for governments and fiscal policy to do the stimulus heavy lifting. In fact, the US Federal Reserves’ monetary support, as a percentage of GDP, is now back to pre-COVID levels, although massive infrastructure spend has offset the removal of central bank’s monetary support, and kept nominal growth upbeat.
Source: ARIA
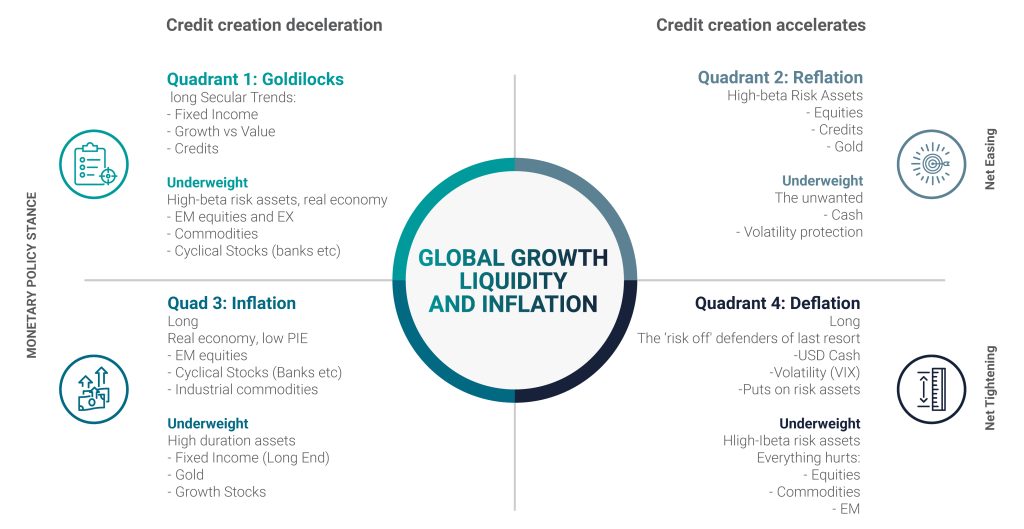
JULY 1ST: REGIME CHANGE
Our forwards looking macro regime investing approach, which uses growth, inflation and liquidity as a macro compass, helps to determine which of the four quads or market regimes – goldilocks, reflation, deflation or decline, best describe the current market conditions. We then reflect in our portfolio’s, asset allocations sympathetic to which quad we sit in. Each quad as you can see below has historically favoured certain assets. Our data indicates a move from Reflation back to Goldilocks – although favouring defensive low growth sectors such as utilities, consumer staples.
Quad Positioning
 Source: ARIA
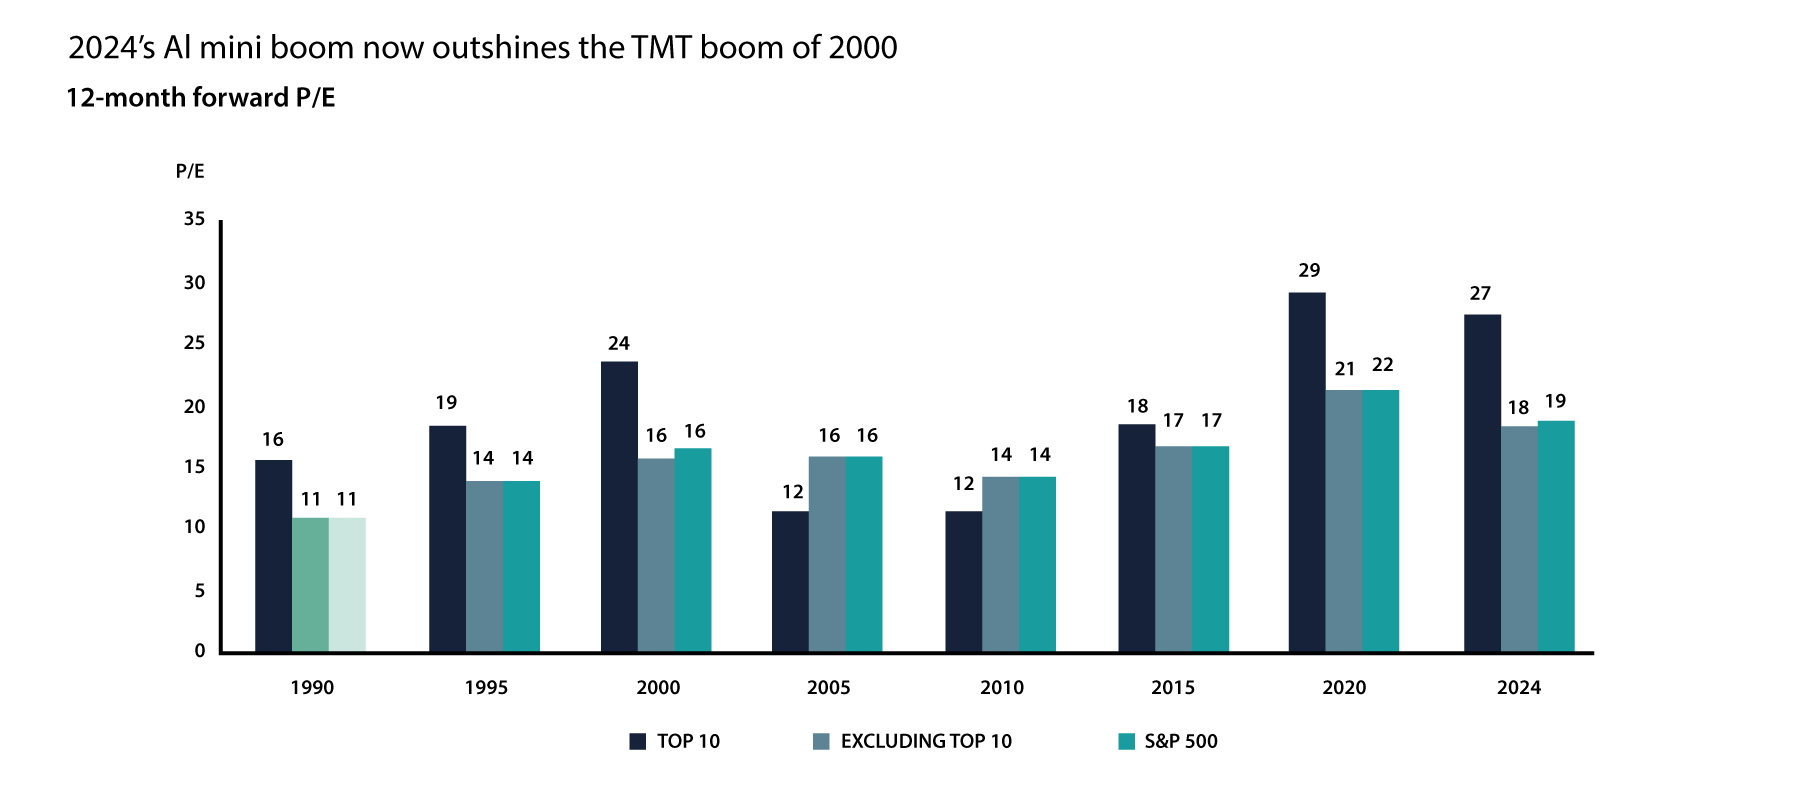
JUNE 24TH: 2024’S AI MINI BOOM NOW OUTSHINES THE TMT BOOM OF 2000
To what degree are we witnessing a ‘mania’? As the poster boy for the bull market, NVIDIA’s recent price action is parabolic and a trend ending signal. By some historical benchmarks, such as valuation metrics, the AI bubble is bigger than its TMT brethren in 2000. AI companies have raised billions, and have spent billions on a capex cycle, creating the demand for Nvidia’s chips. As we stand, many are still awaiting a product to match the capital committed to date.

Source: Bloomberg, Apollo Chief Economist, ARIA
JUNE 24TH: 2024’S AI MINI BOOM NOW OUTSHINES THE TMT BOOM OF 2000
To what degree are we witnessing a ‘mania’? As the poster boy for the bull market, NVIDIA’s recent price action is parabolic and a trend ending signal. By some historical benchmarks, such as valuation metrics, the AI bubble is bigger than its TMT brethren in 2000. AI companies have raised billions, and have spent billions on a capex cycle, creating the demand for Nvidia’s chips. As we stand, many are still awaiting a product to match the capital committed to date.
Source: Bloomberg, Apollo Chief Economist, ARIA
JUNE 17TH: AI VERSUS TMT BOOM ANALOG
To what degree are we witnessing a AI fuelled stock market ‘mania’? By some historical benchmarks, such as valuation metrics, the AI bubble is bigger than its TMT brethren in 2000. AI companies have raised billions, and have spent billions on a capex cycle, creating the demand for Nvidia’s chips. As we stand, many are still awaiting a product to match the capital committed to date.
Source: Bloomberg, Apollo Chief Economist, ARIA
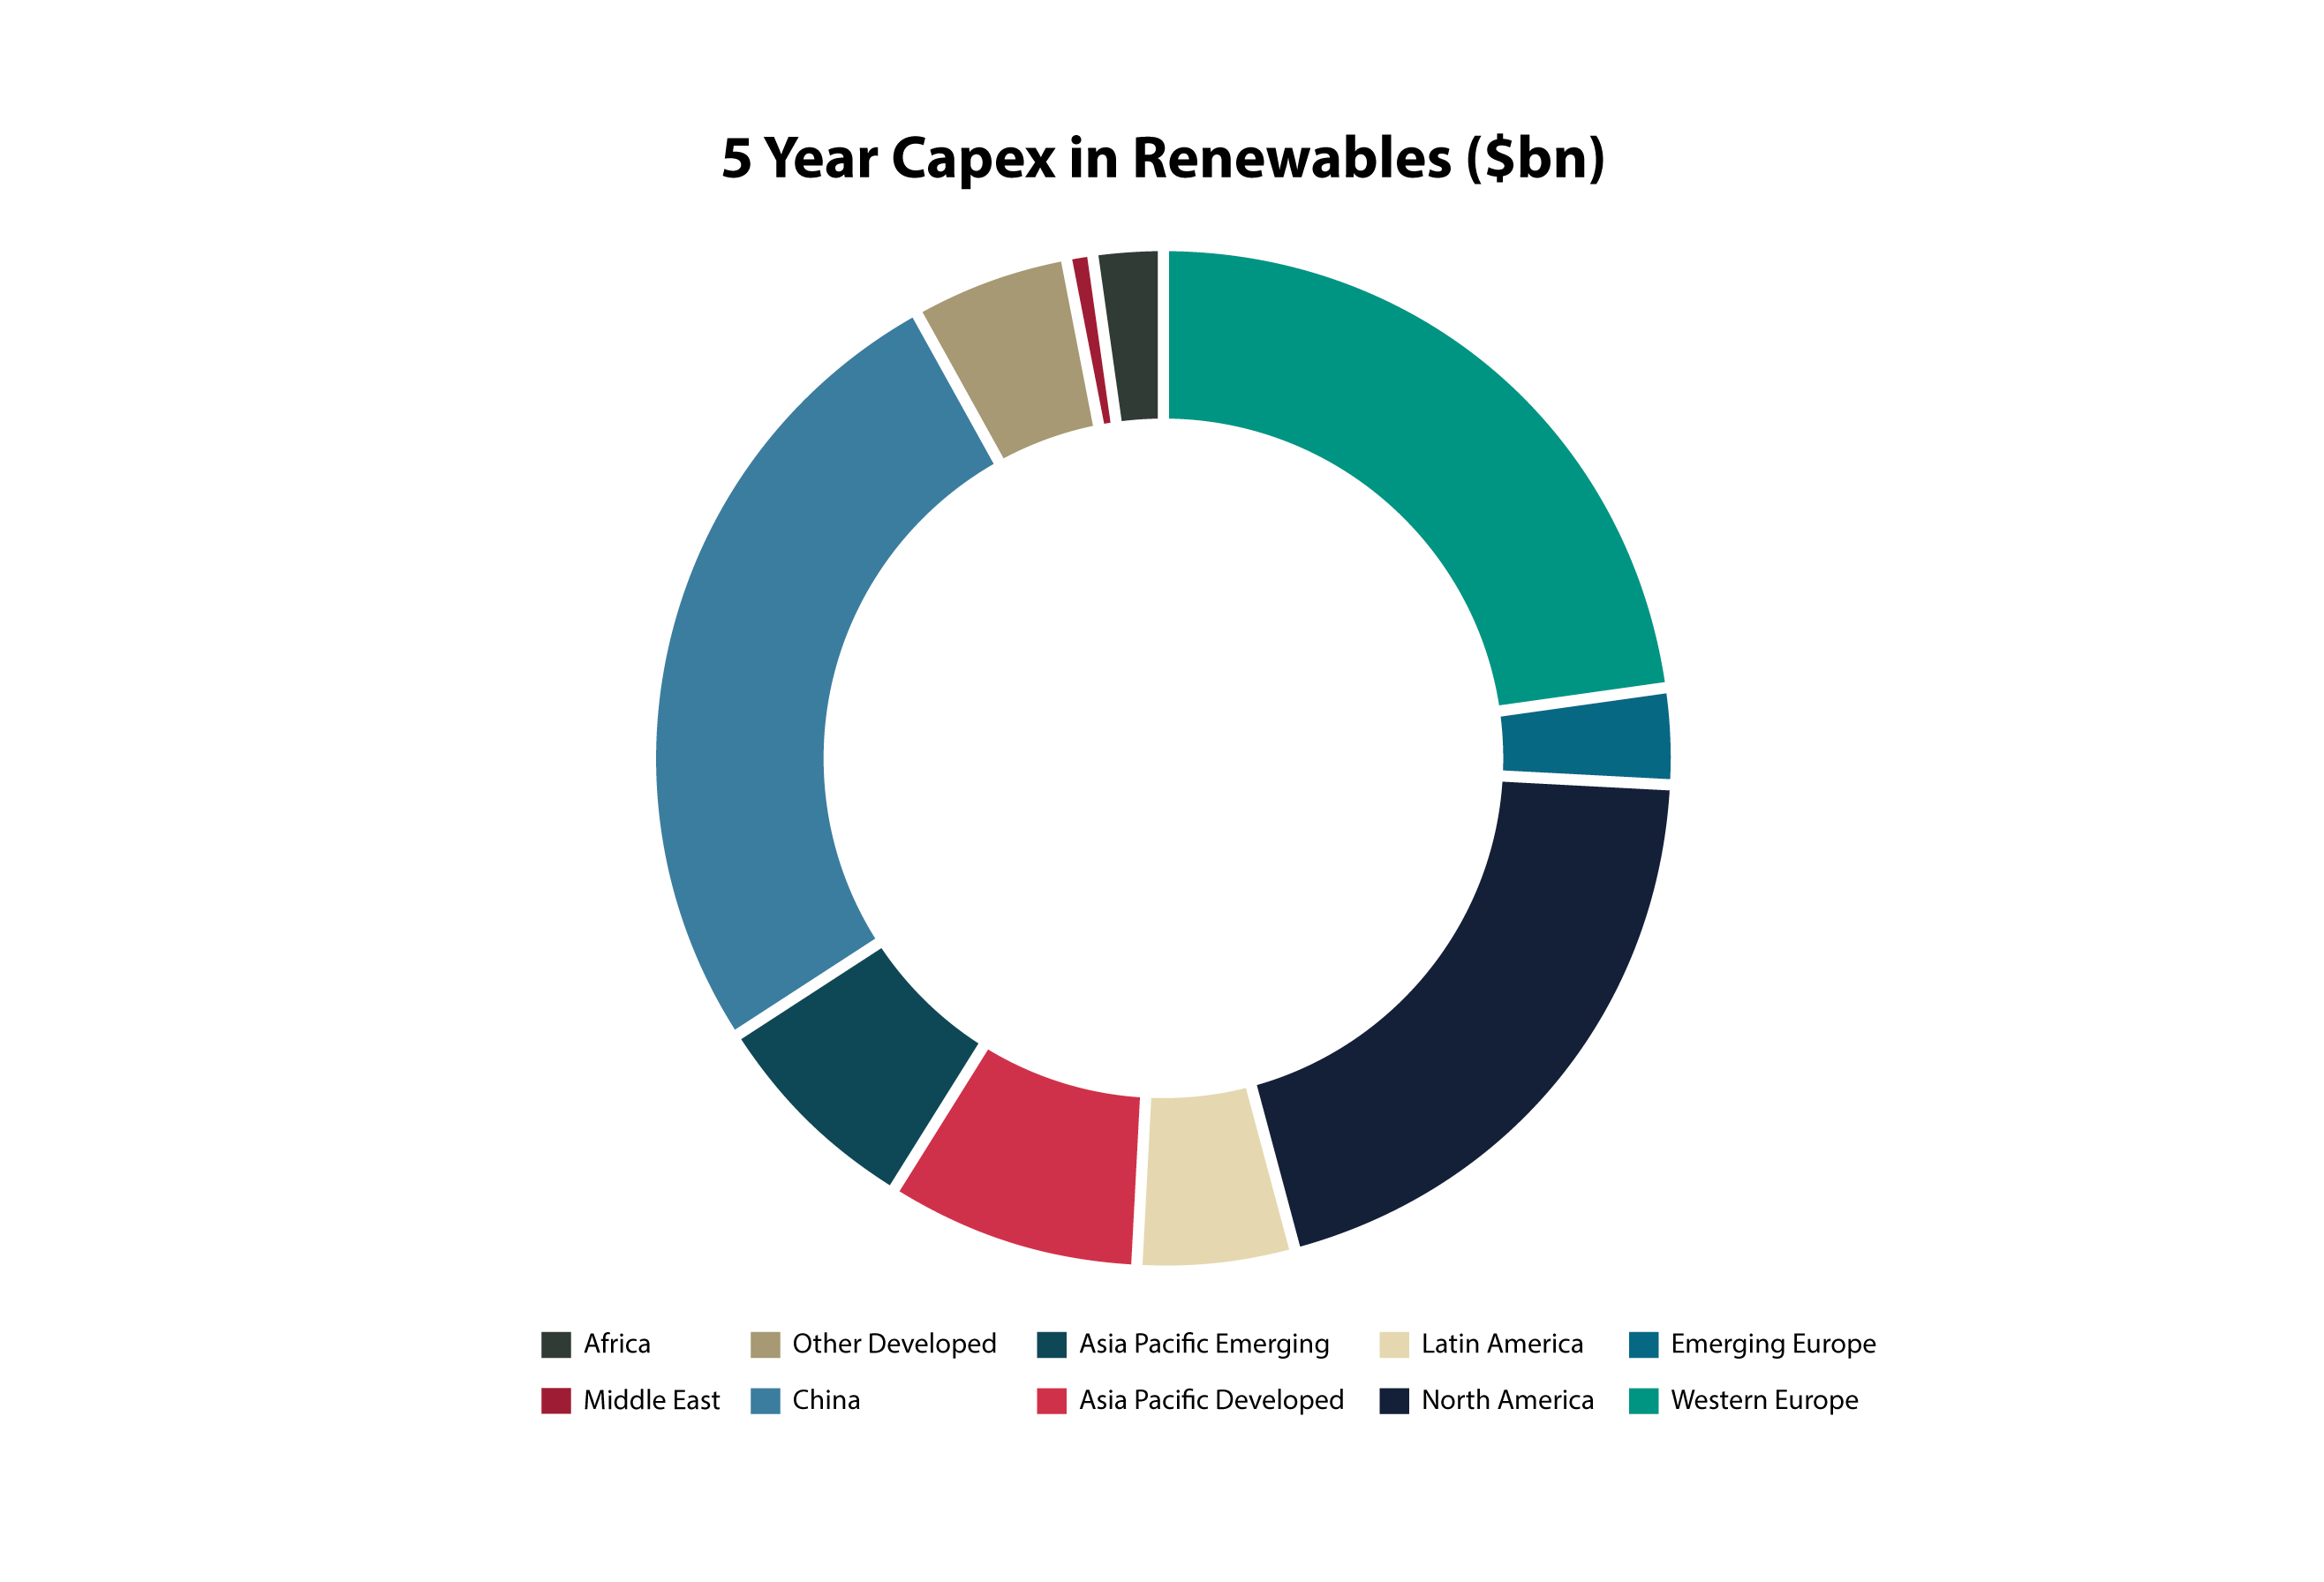
JUNE 10TH: AFRICA’S DECADE
Whilst sub-Saharan Africa continues to struggle with massive energy deficits, it only accounts for approximately 2% of new renewables energy spend. A continent blessed with solar irradiation resources is particularly well positioned, and in need of, realising the transition as soon as it pragmatically can.
 Source: ARIA, Bloomberg
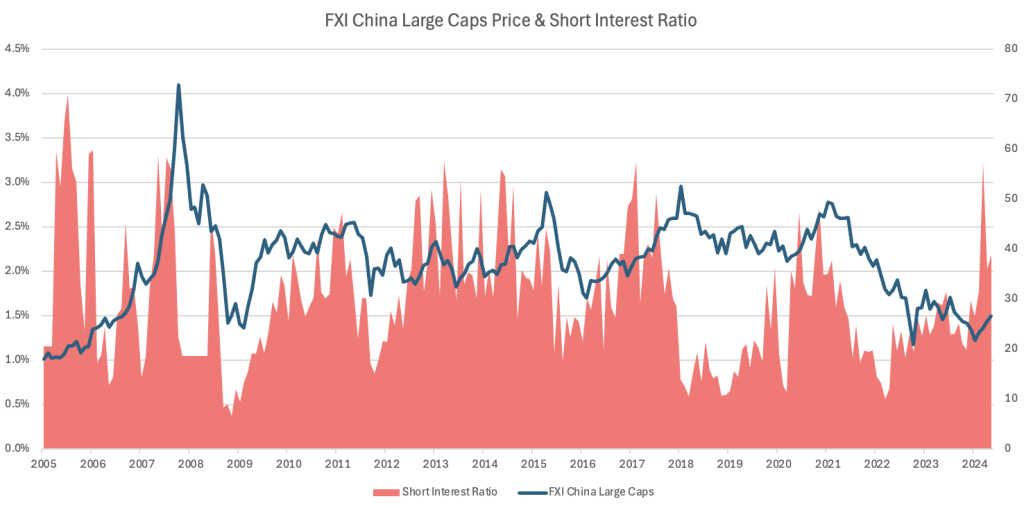
JUNE 3RD: CHINESE BULL
There are more than a few reasons to suspect the Chinese stock market has seen an intermediate, and probably long term bottom. Not least the historic spike in short positions in the Chinese FXI ETF, suggests selling had reached an extreme.

Source: ARIA, Bloomberg
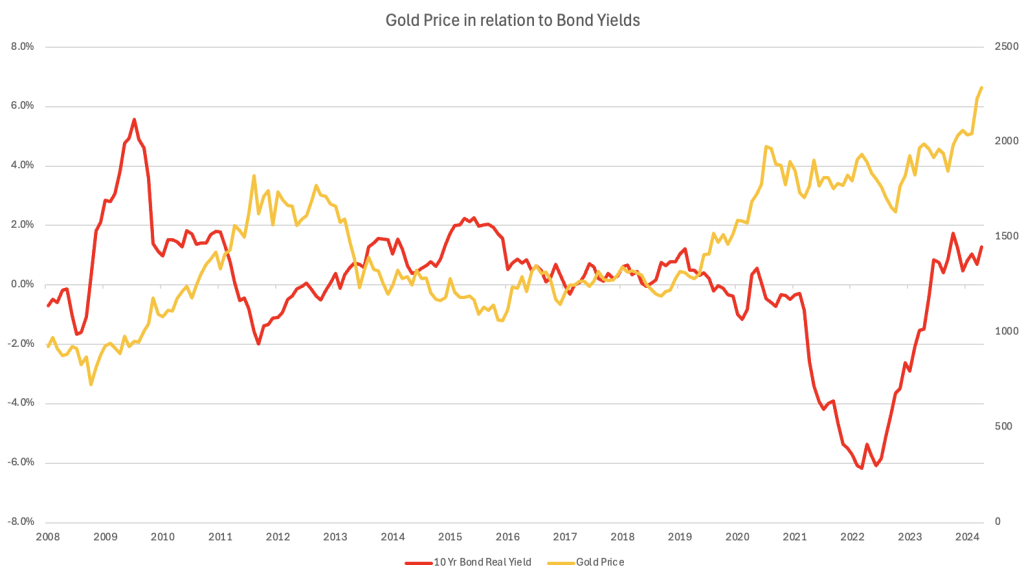
MAY 27TH: THE CURIOUS CASE OF GOLD AND BOND YIELDS
Usually rising interest rates would at least cap Gold’s price appreciation. In fact, often the two demonstrate an inverse relationship. However, in the recent past, even whilst bond yields have moved higher, Gold has appreciated nonetheless – in part no doubt driven by geo-political tensions perhaps.
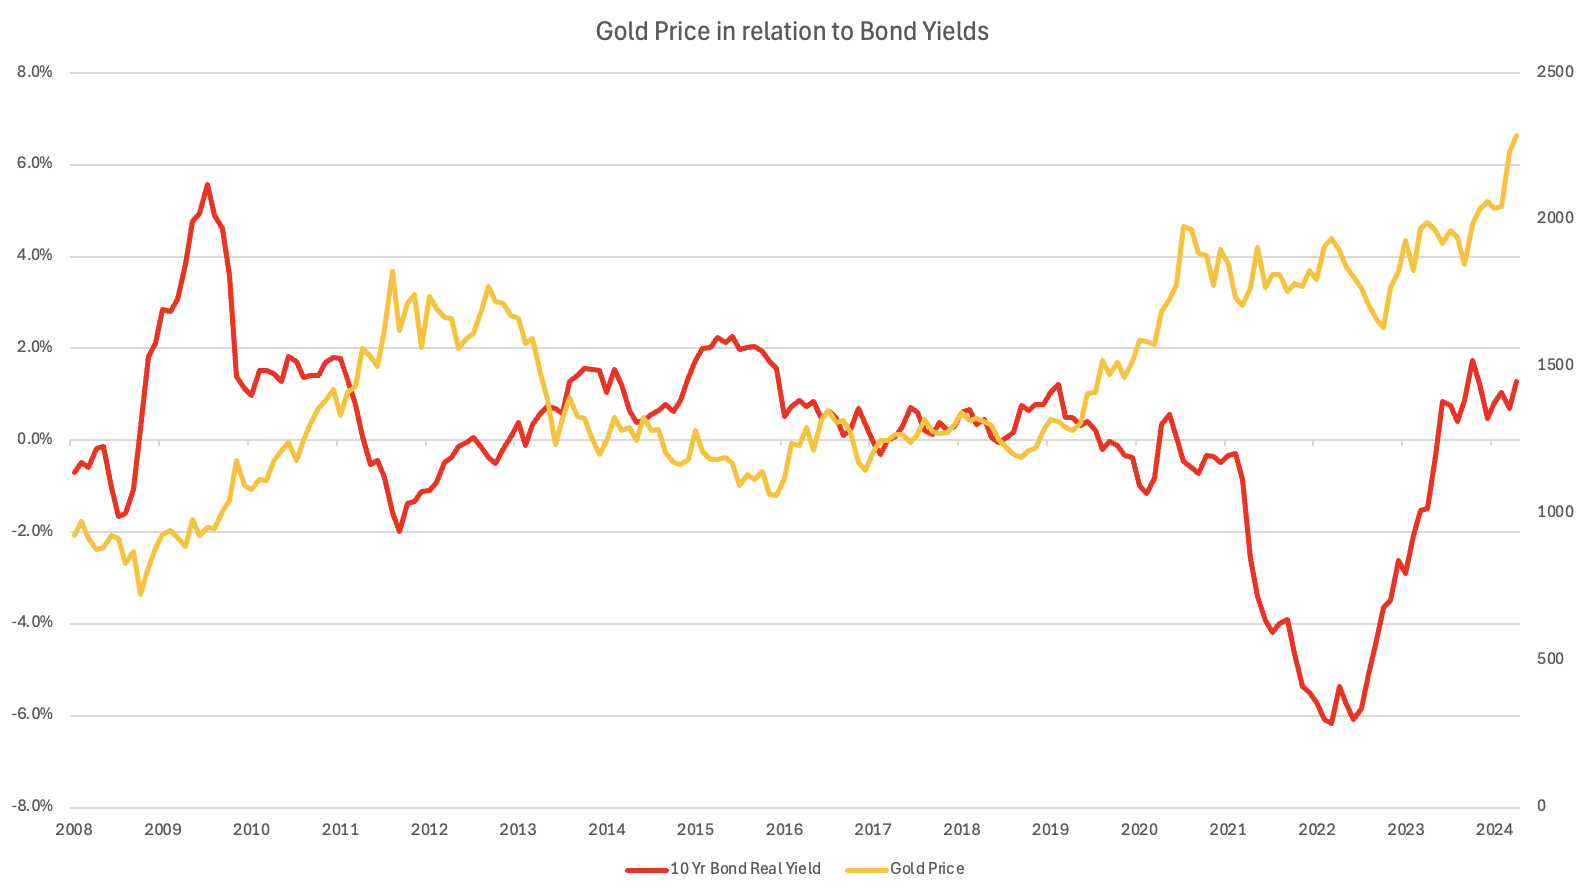
Source: ARIA, Bloomberg
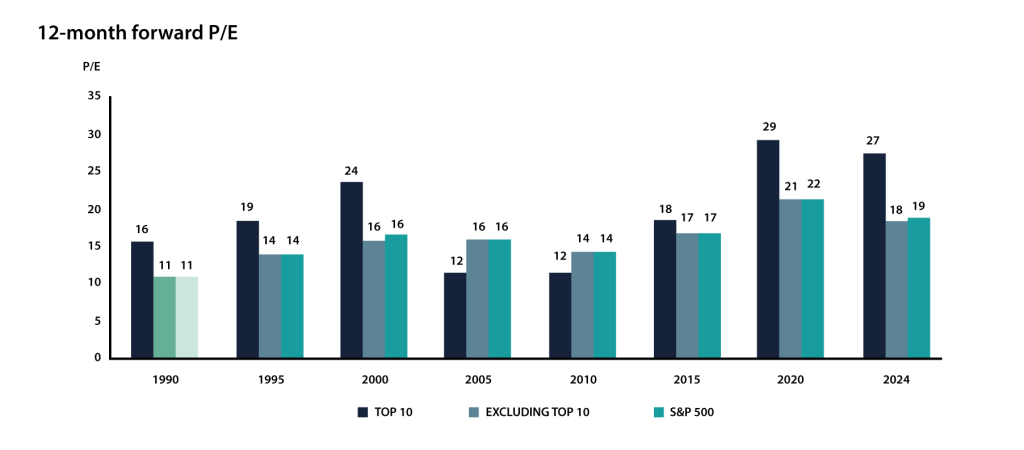
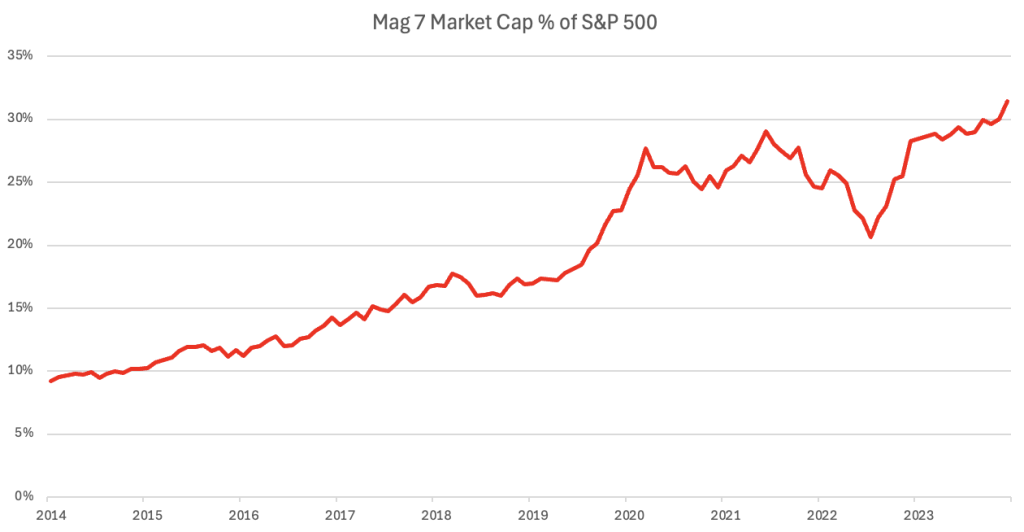
MAY 20TH: THE ‘MAG 7”S INCREASING INFLUENCE
US large cap tech, notably Nvidia in recent times, have often accounted for much of the wide US market’s performance. However, rarely have they accounted for our 30% of the market’s capitalisation.

Source: ARIA, Bloomberg
MAY 13TH: US CONSTRUCTION CAPEX DRIVES INTEREST RATES
Biden’s tenure has been characterised with three major pieces of legislation, including the Inflation Reduction Act, that has generated massive infrastructure spend. Such large government fiscal stimulus tends to lead higher interest rates, although the pace has begun to slow more recently, perhaps removing one tailwind for the ‘higher for longer’ narrative.
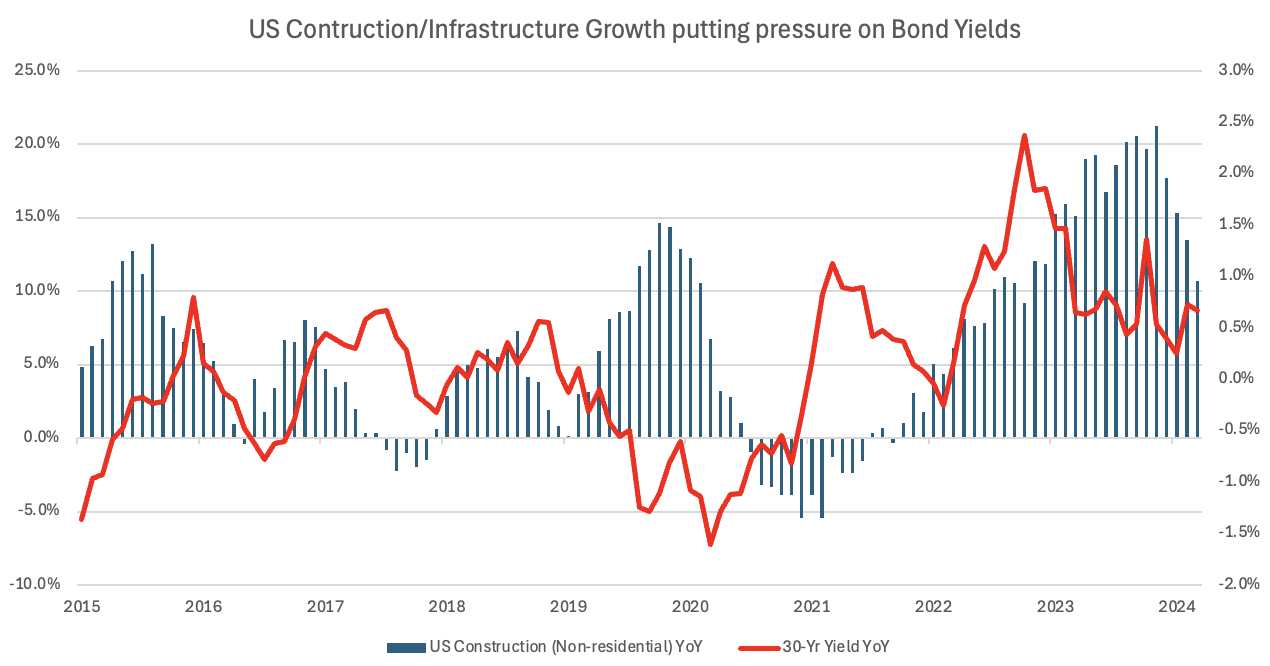
Source: ARIA, Bloomberg

Considering the Alternatives: Navigator Approach to Portfolio Management How best to protect and grow wealth? ...

Currency Climate Change and Gold as a future international reserve asset Bullion, for the reasons ...

The Case for Commodities: Greenflation and Copper as the new Crude If the shockwaves that ...